to support bike riders
Project Brief
To design a digital interface that makes the best use of the AR technology in assisting riders and mechanics to visualize the health of the bike in real time.
Type
Course Work | Design for Human Machine Systemic Relationships | Semester 1 | IIT Kanpur | Solo
Approach
Following the Ecological interface design approach in a way:
Abstraction hierarchy
Work Domain Analysis
Part Whole Decomposition
Part Whole Hierarchy
Defining Scope
Understanding the work domain
Conceptualizing Scenarios
Ideation
Wireframes
Variable constraints
High fidelity wireframes
Prototype
The interface design is dependent on Variables currently/that could be measured by sensors.
The system boundary was mostly restricted to the bike with no inclusion of environmental conditions.
The objective of it was such that not just the rider but even the mechanic/company can be in the loop and keep giving reminders regarding the status of the bike to the user.
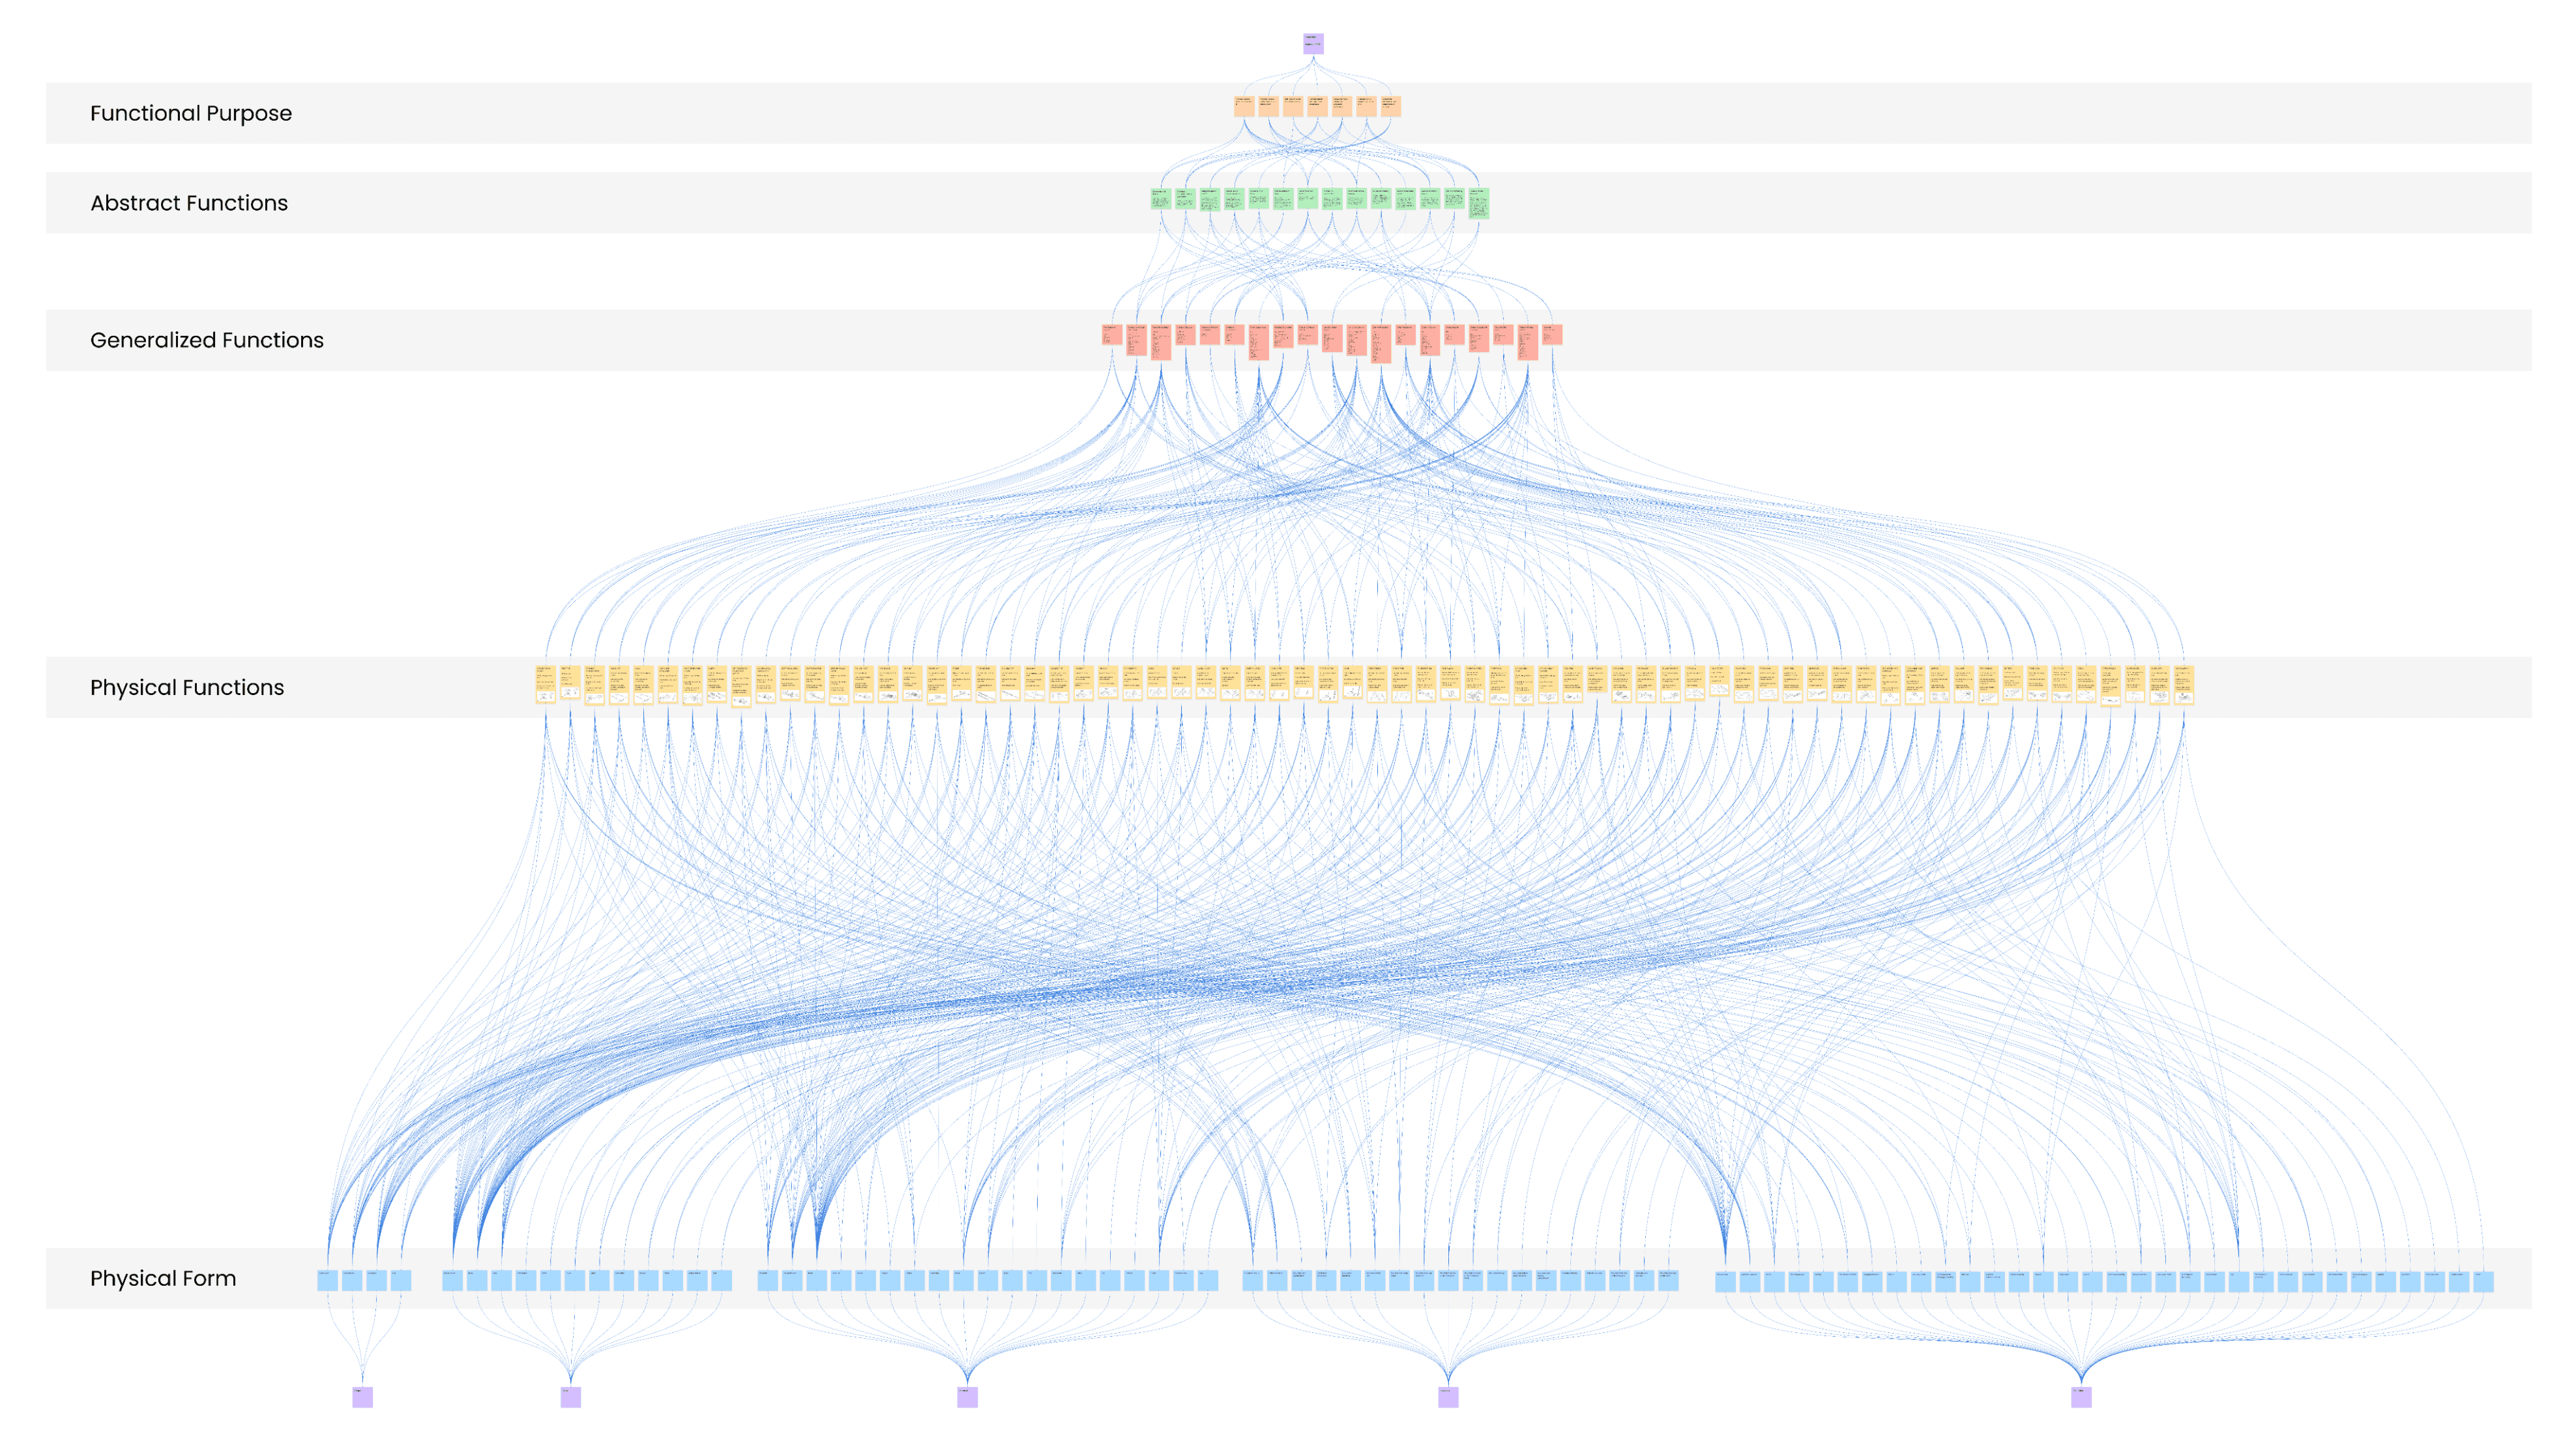
The project focuses on analyzing motorbike as a whole complex system using EID approach. By breaking down the motorcycle into its functional purpose, abstract functions, generalized functions, physical functions, and physical form, the study aims to understand how complex systems can be simplified in a better format for a day to day user.
The work examines rider motor cycle interaction, information flow through the interface and how mechanic can be aware of the bike status.
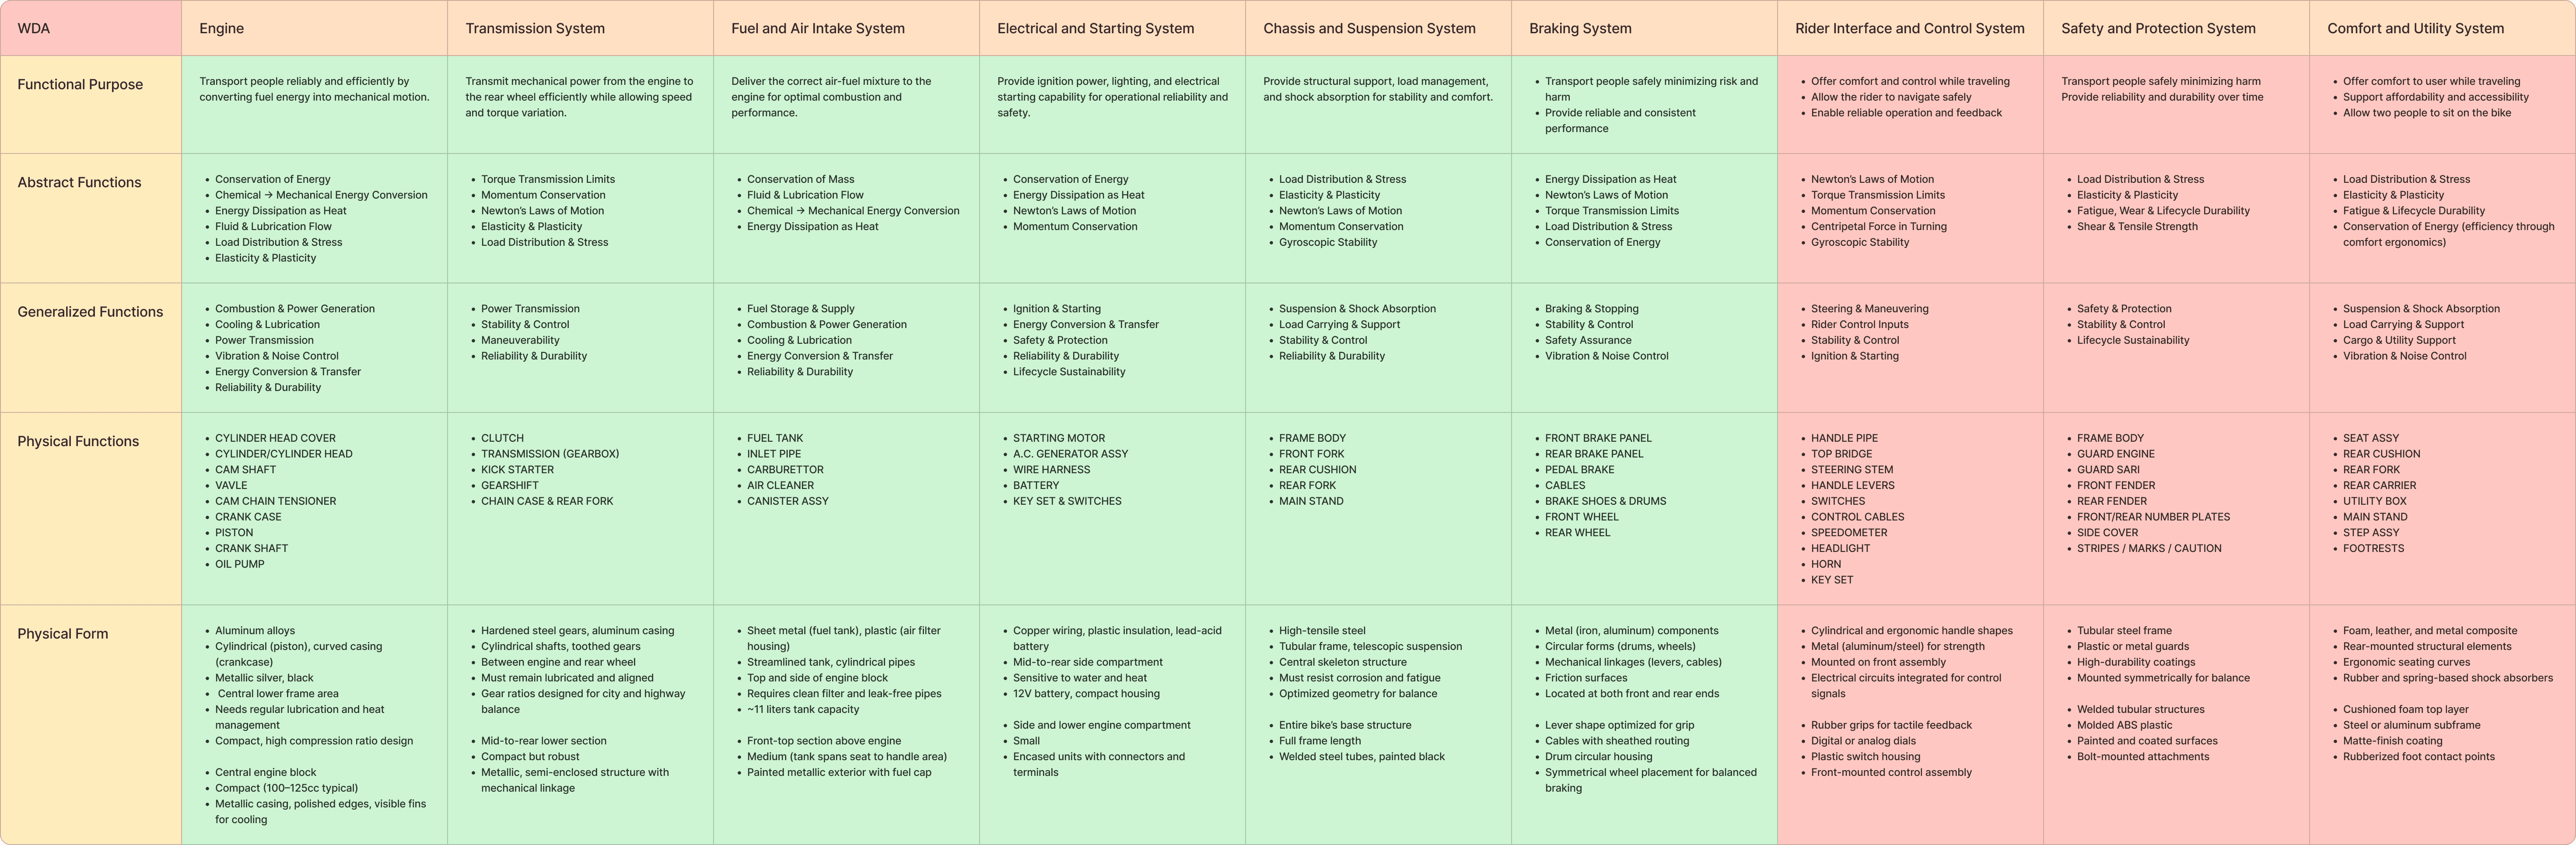
Work Domain Analysis
The Physical functions were divided into 9 core subsystems which were:
(every time all components clustered into these 9 subsystems.)
Engine
Transmission System
Fuel and Air Intake System
Electrical and Starting System
Chassis and Suspension System
Braking System
Rider Interface and Control System
Safety and Protection System
Comfort and Utility System
Part Whole Hierarchy
You can check the whole table here Link
After this we decided to move with as the main subsystems which would be the part of the interface.
Engine
Transmission System
Fuel and Air Intake System
Electrical and Starting System
Chassis and Suspension System
Braking System
and discarded these 3 from the interface
Rider Interface and Control System
Safety and Protection System
Comfort and Utility System
Sketching Ideas

While ideating I was constraining myself to working on a interface for the mechanic but later on I decided to work on a AR interface which would useful for the rider (user) and would connect them with the mechanic when needed.
Ideated base level of ideas from few hours of ideation:
So the user would mention the bikes number or something so that the app knows when the bike was bought
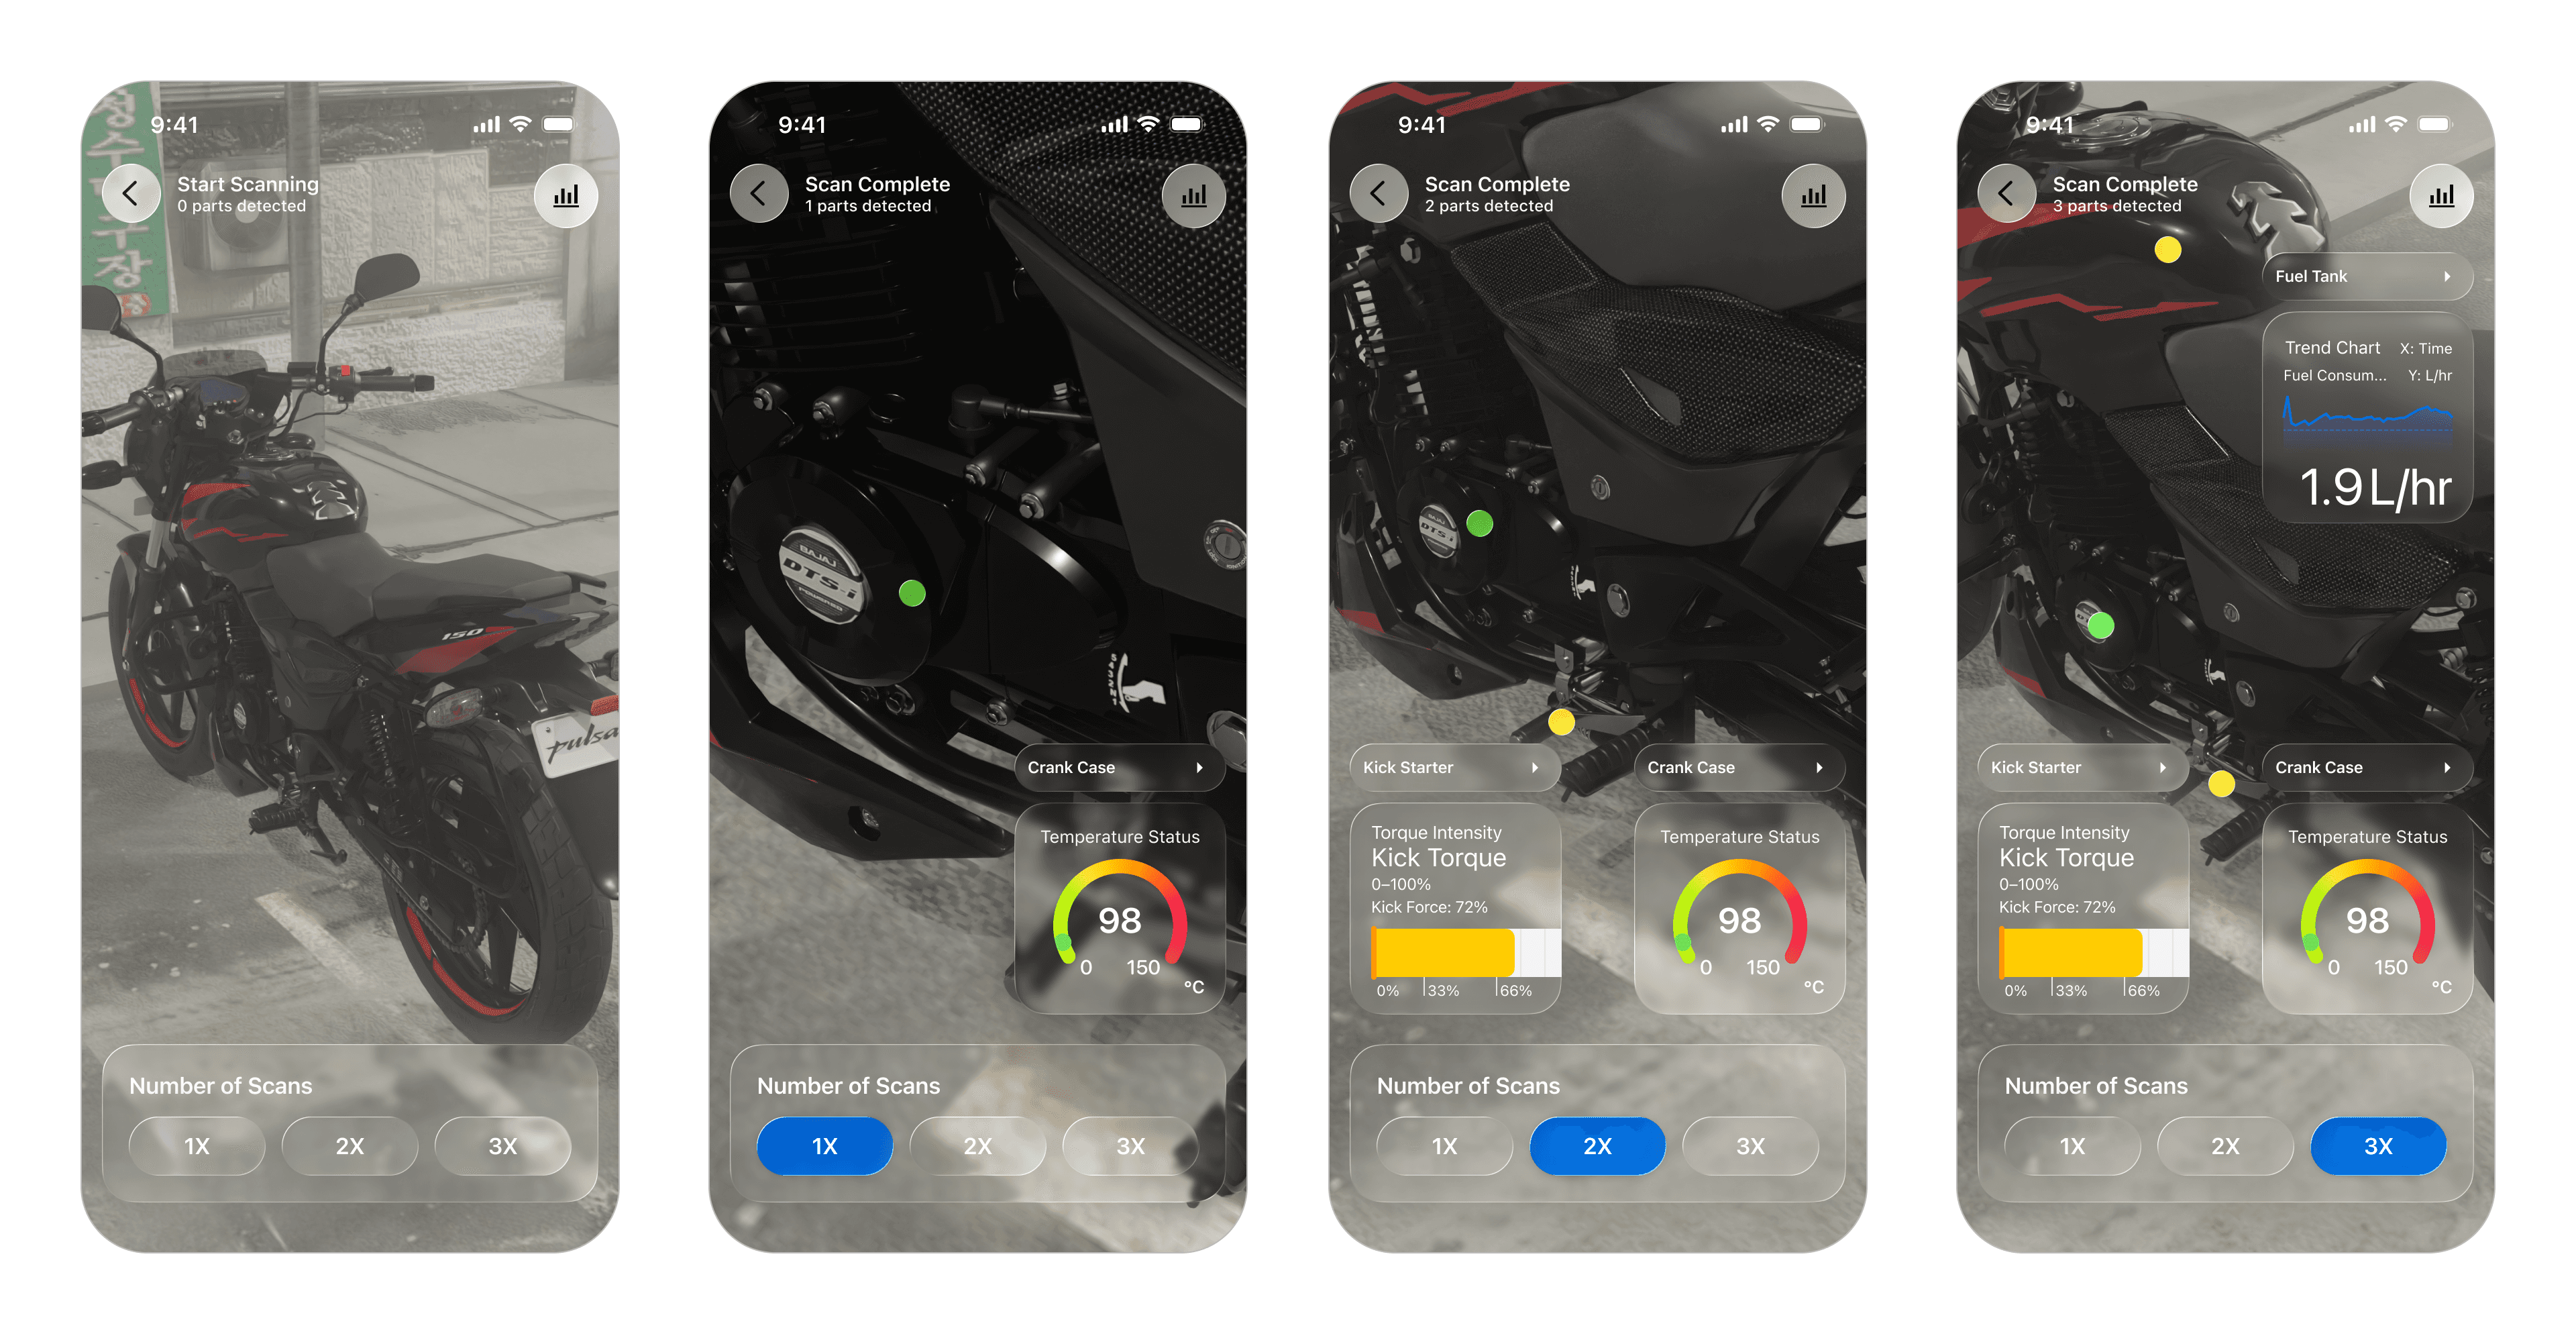
So the user can scan through any part of the bike by just putting the phone above that and it will show the time remaining for the maintenance or on which year he should get the maintenance done for that particular part. Basically if the life span of engine is 5 years for example then after 3 years if he scans it it would show to him that it needs to go through maintenance after 2 years.
when scanned a part it would also show all the sub parts of of the part which are in the last two stages of abstraction hierarchy.
you can even scan two parts at the same time at the pop ups on the app with every info for every part would come along
every time the bike elements are upgraded they can be updated on the app manually
you can connect with the company/mechanic if something goes wrong with the bike and connect with them to see what might the issue be
In AR when scanned the colors of the objects would also change to say from green to yellow to orange to red according to the emergency of the need to get the maintenance of the bike done
if you go for a regular maintenance check up as well the mechanic will only update those parts of the bike on the app which were corrected from their end and not increase the life span of the parts which he did not check on or did not upgrade
There would be a different warning when parts come to their end of the life (1st,2nd,3rd warnings)
Mechanic would receive notifications as well from the world to know which bike has got a maintenance issue in which part and they will call each of them to get the check done for the part.
When the bike is also moving you can show real time status like which part is how much heated or do you need to slow down according to it.
Telling at what speed what bike part might get a lot of heat
The fuel flow or the spinning of the mechanical parts might be show on AR
How different parts can be interconnected when bike starts and how one can be damaged through other.
AR would have inbuilt different updates with the bike since years
In AR already show wear and tear of certain parts in 1 year or 2 year through AR so that the user gets concerned and not just tell them by words that it needs maintenance
can even cut open bike from any middle of the bike to see how things are going
different ways to zoom in like multiple objects or single objects or dual or the whole bike at the same time. all can have icons to easily identify which way you want to scan
zoom in and out so the cards would come in and out
also zooming in the parts so you can see the parts even up close
Conceptualizing Scenarios
Routine Check Before a Ride
Unexpected Issue During Ride
Maintenance Assistance in Workshop
Post-Repair Validation
Faulty Sensor / System Error
Predictive Maintenance Notification
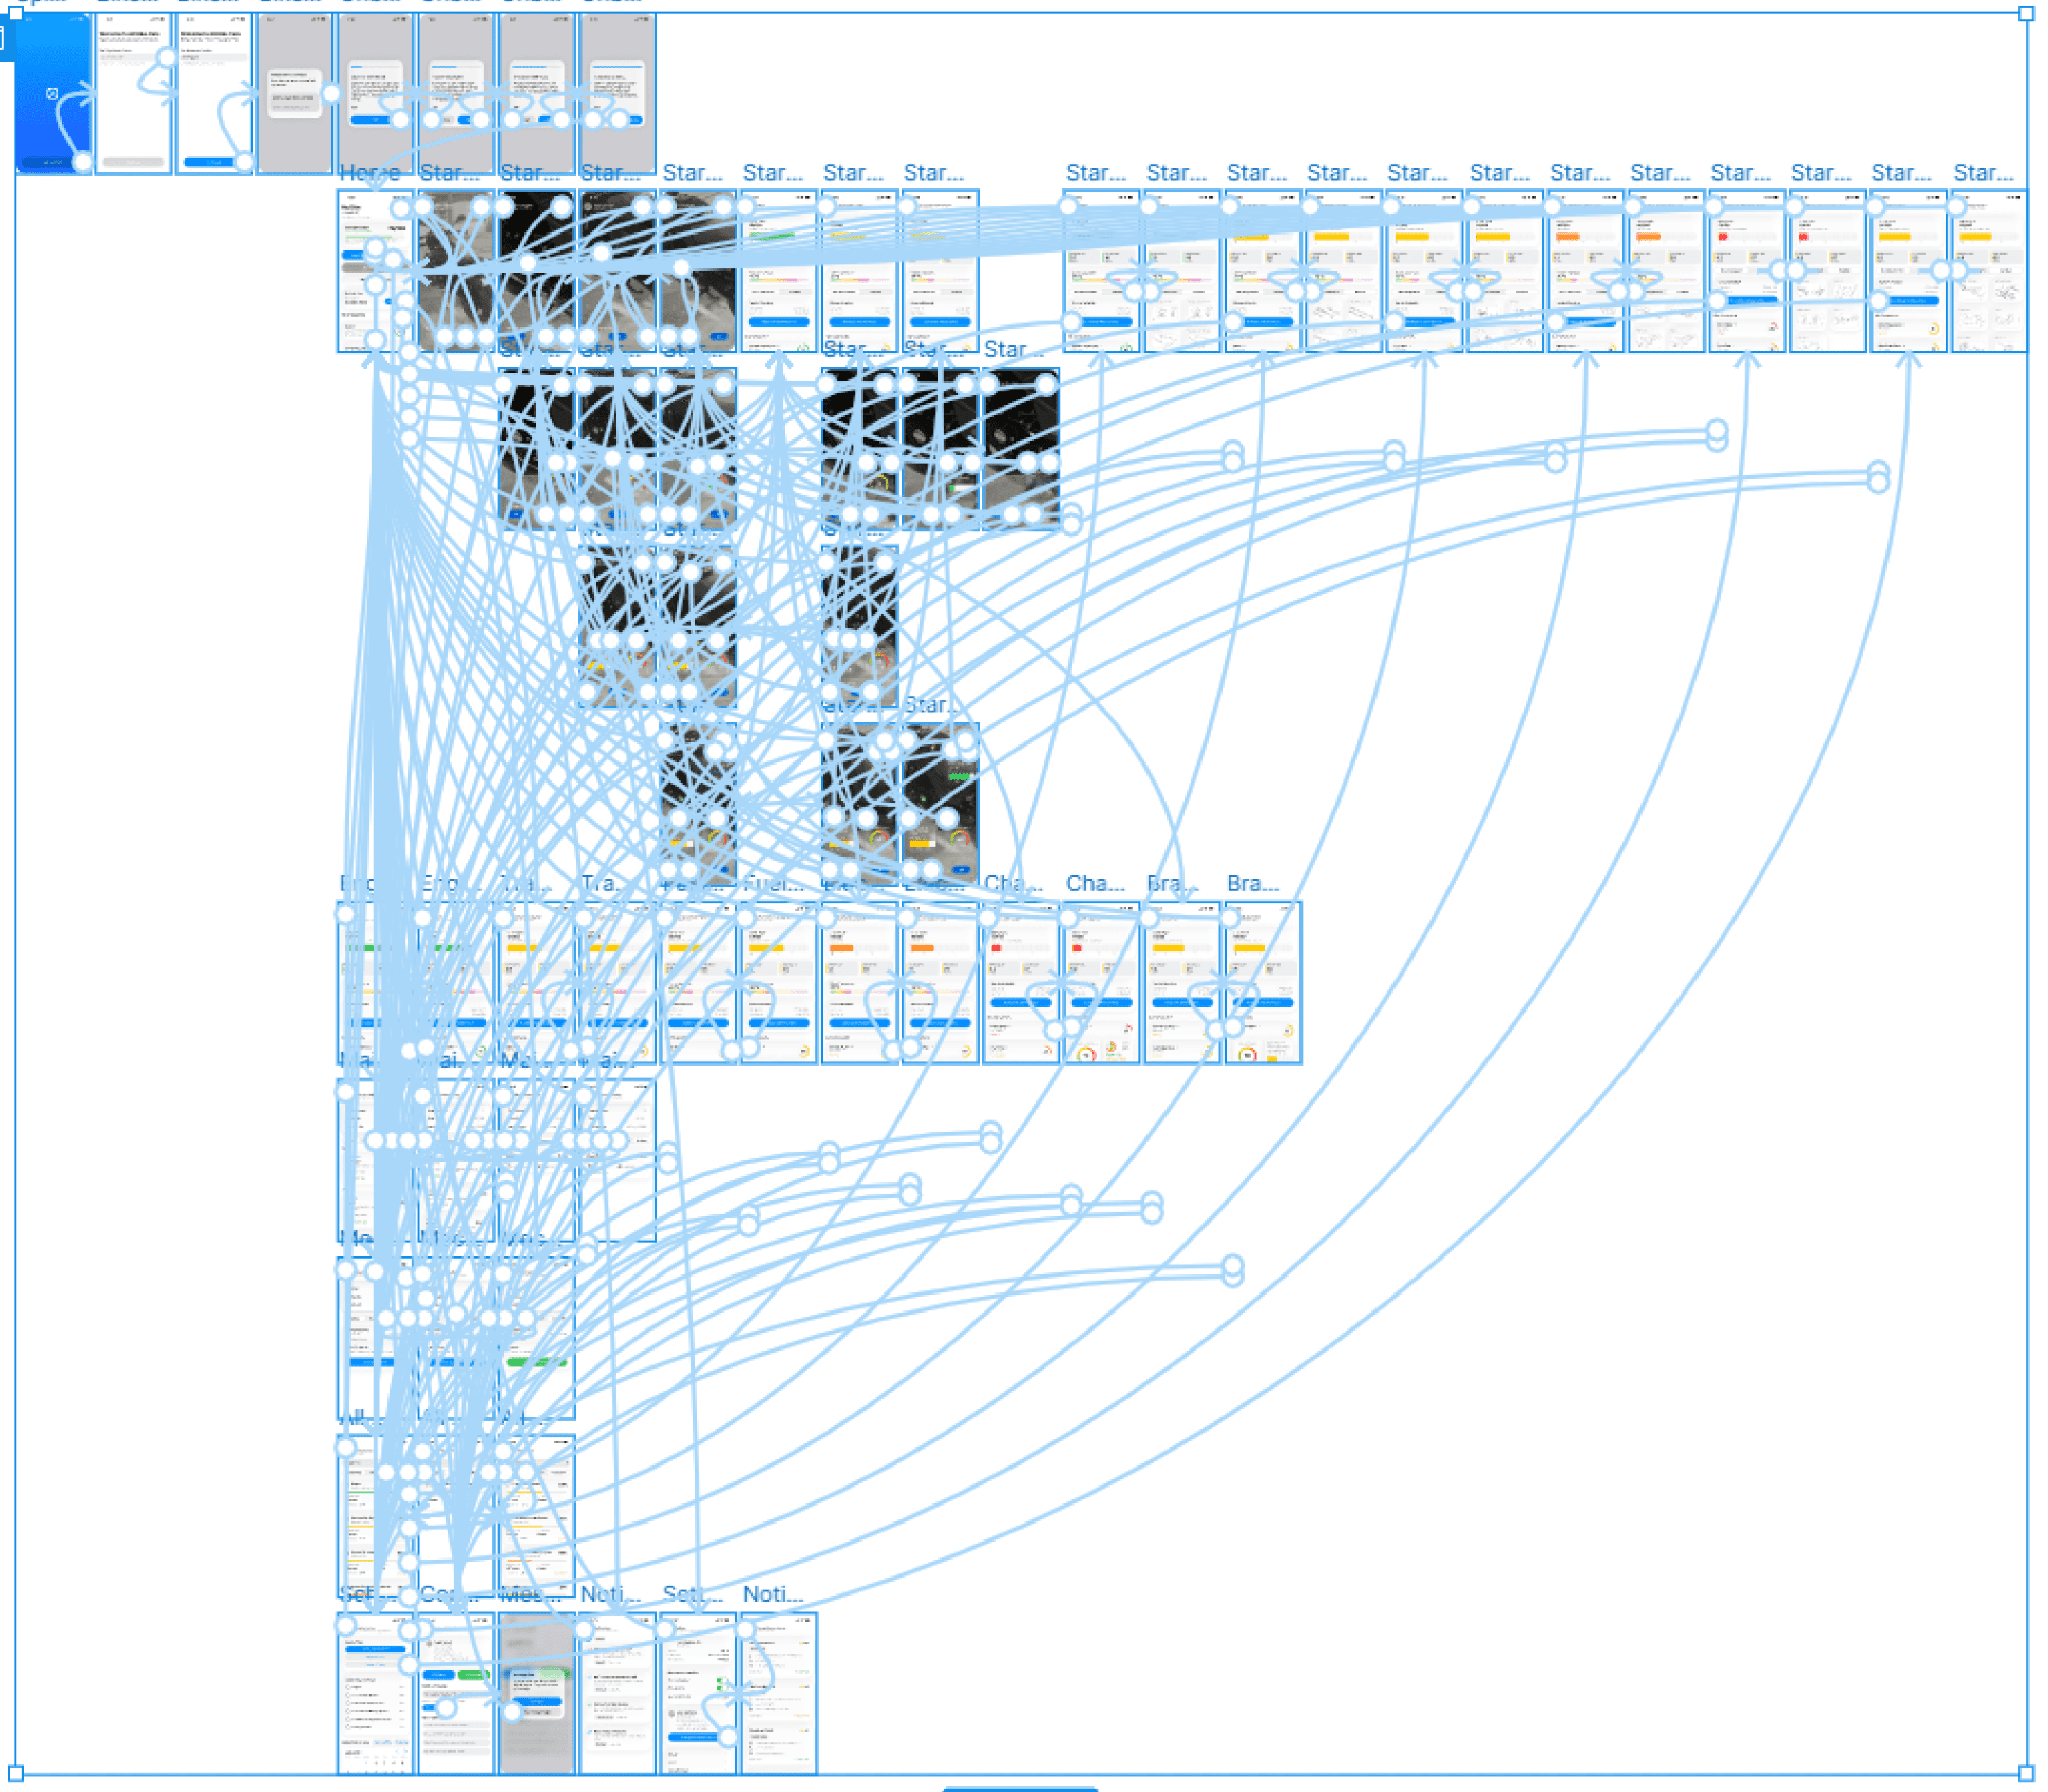
Low Fidelity - Wireframes
You can check all wireframes here Link

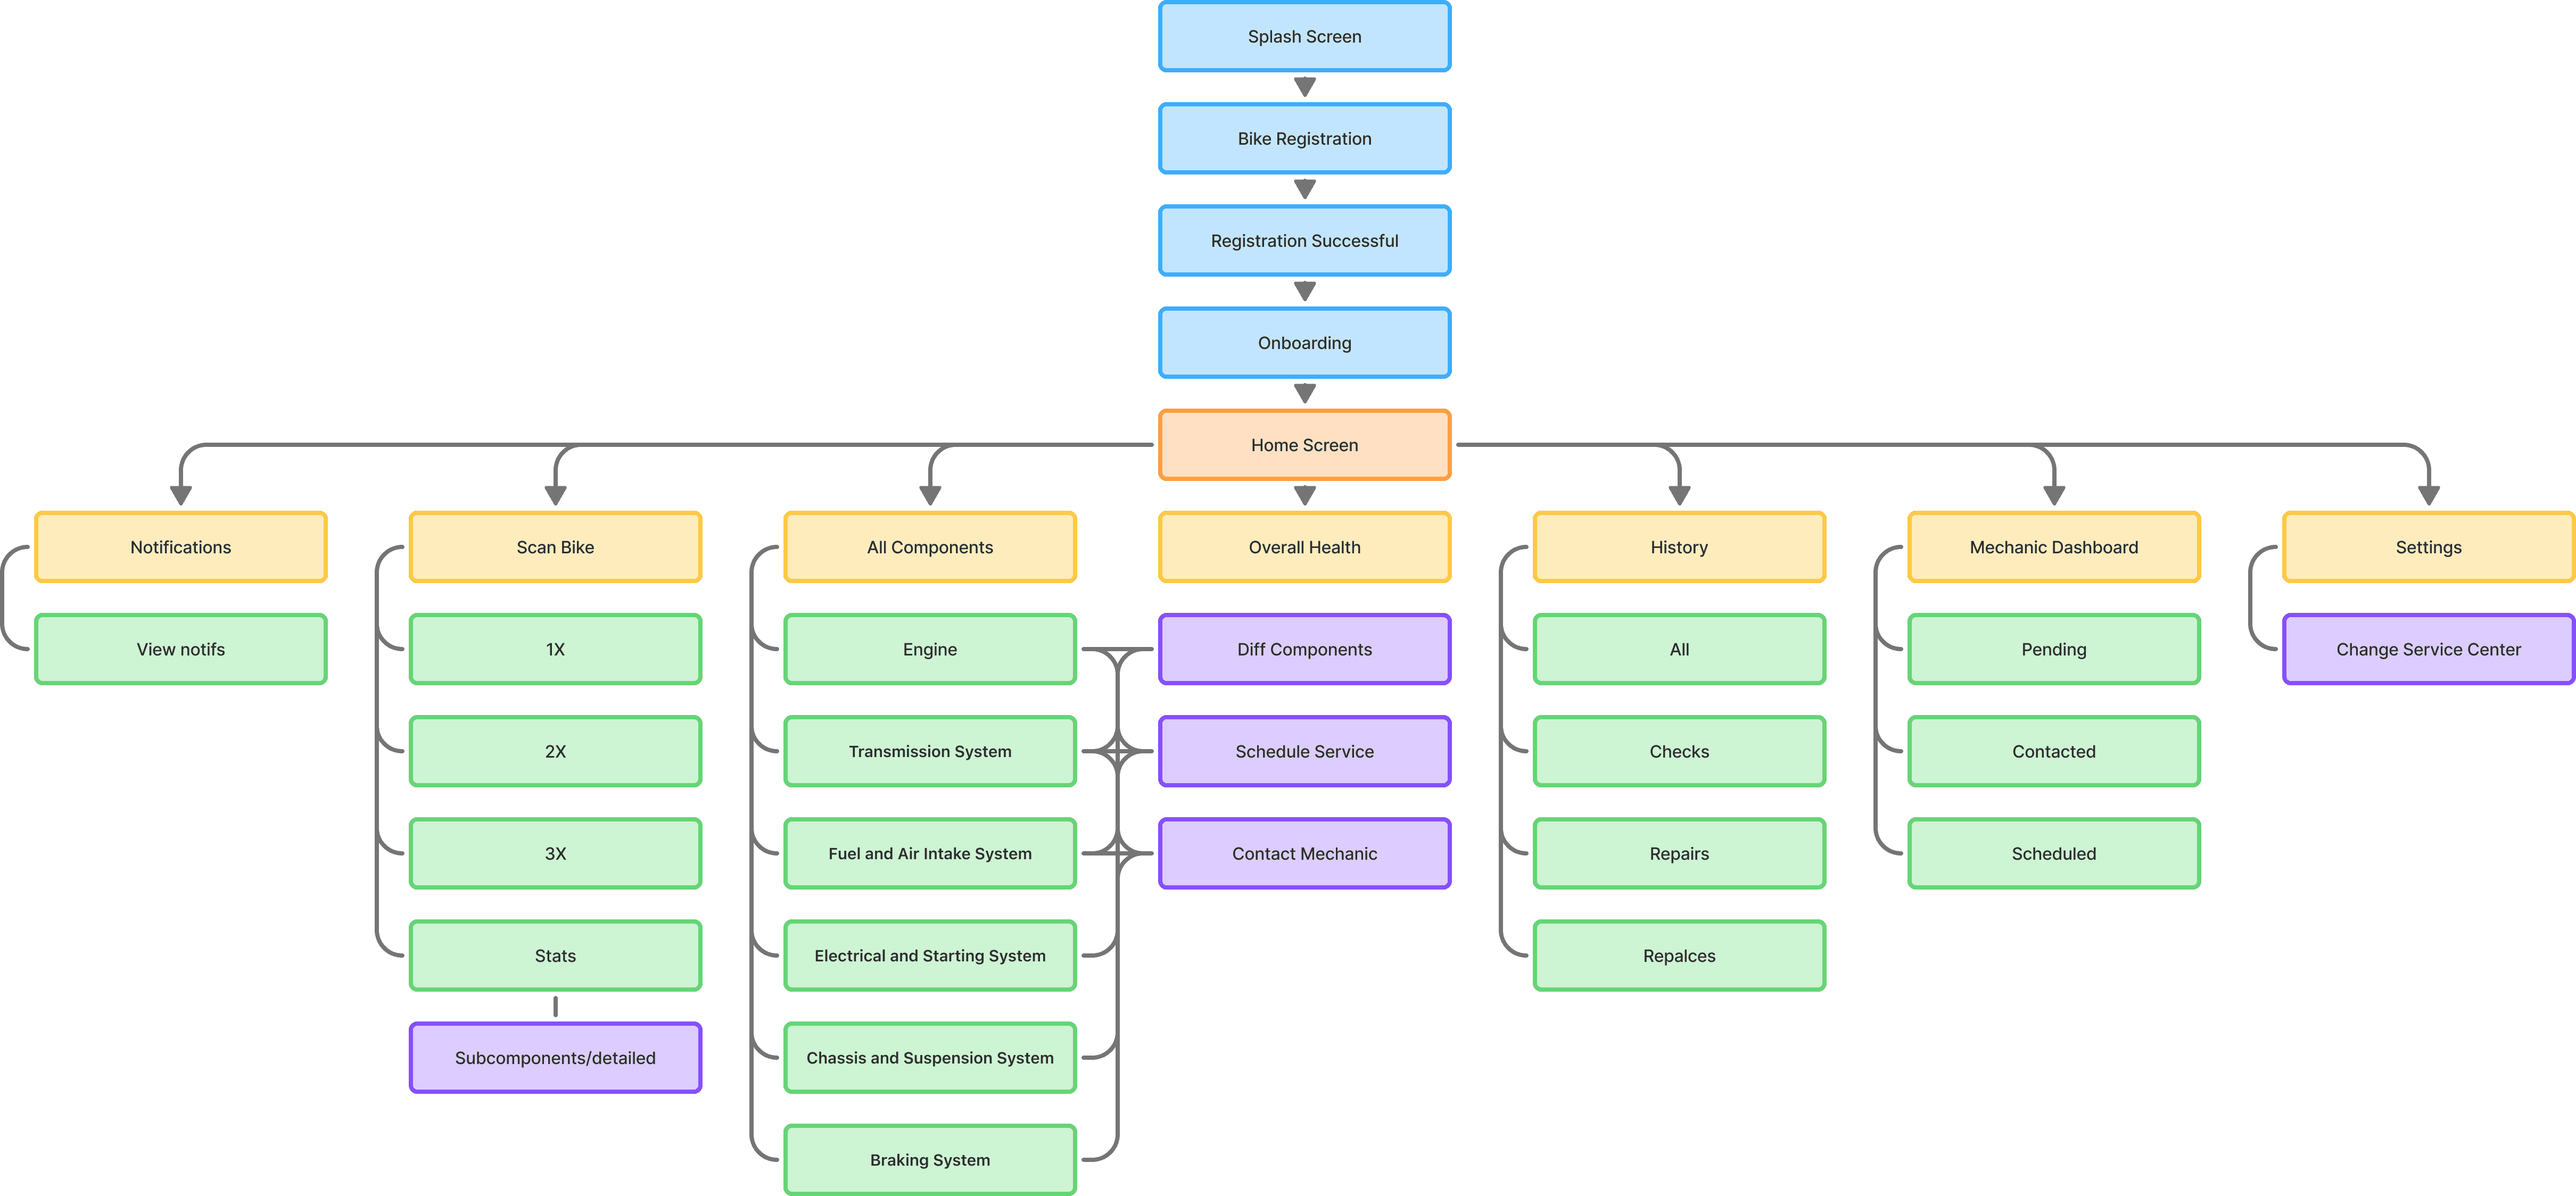
Information Architecture
After this the structure of the interface was set and what left was to set the variables of the components and structure how the interactions of them would work. Link
Deciding types of variables of Components (using Abstract Functions)
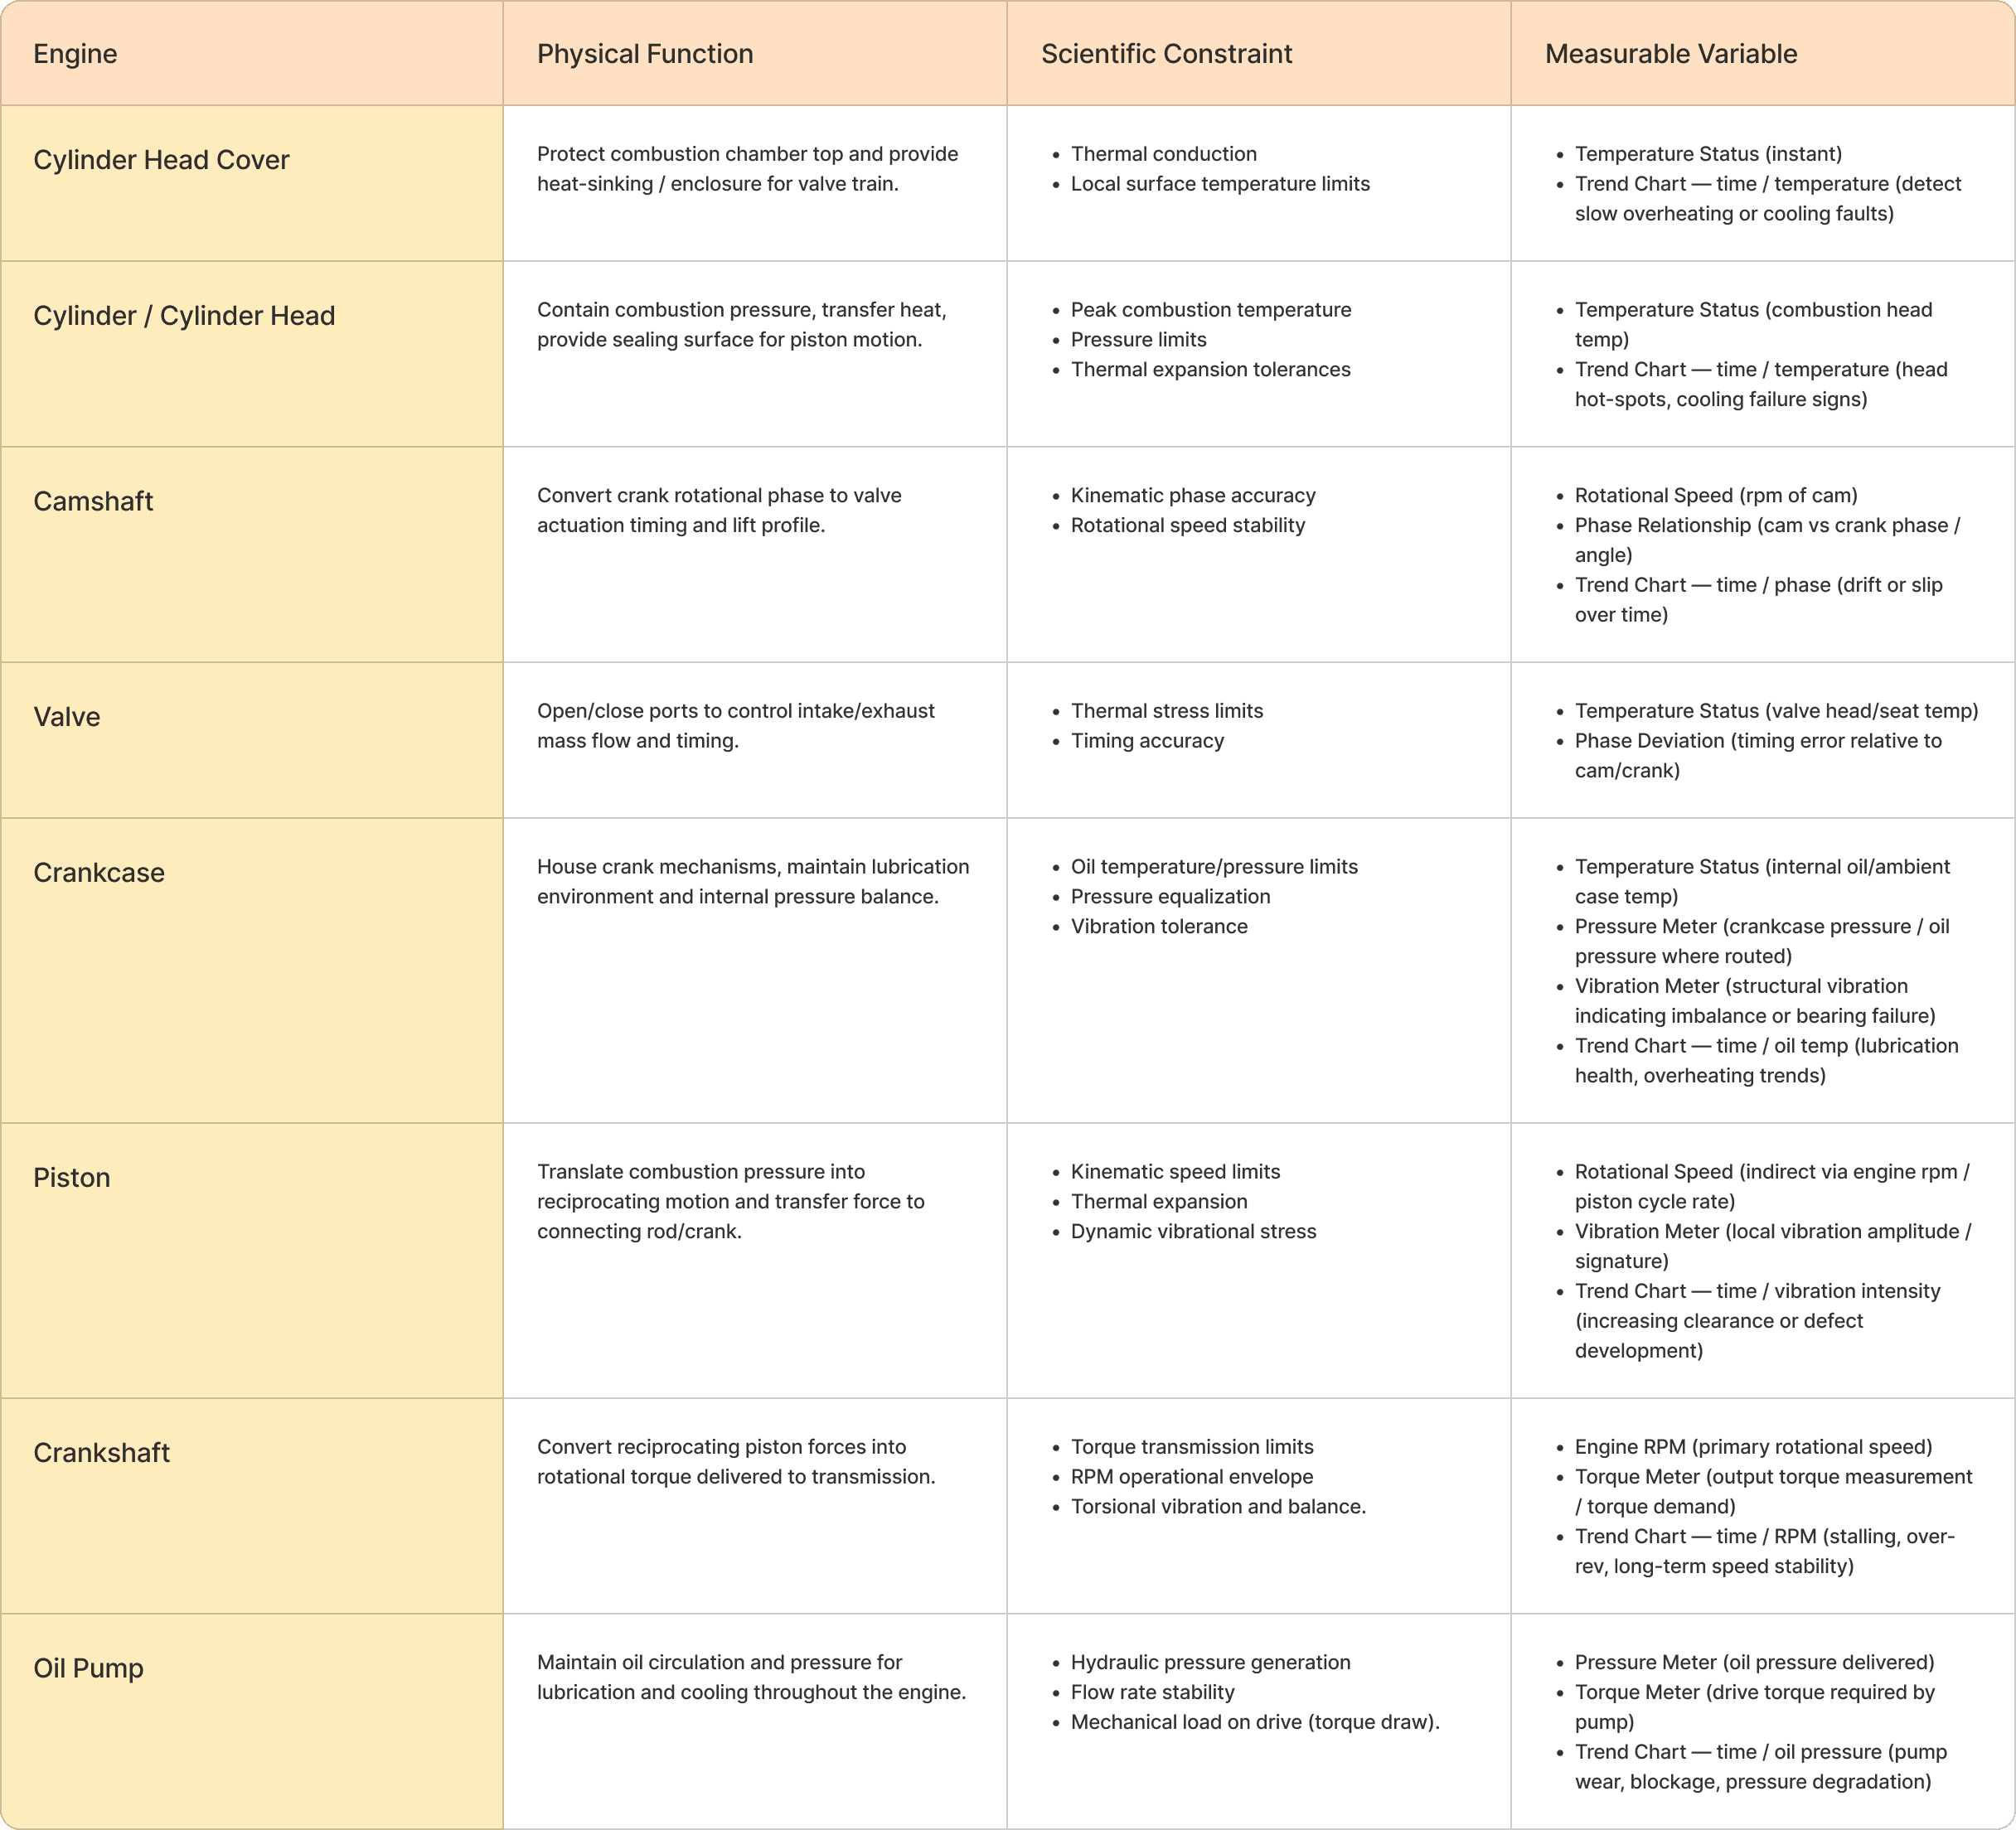
I had to decide what variables to measure for what components for which I had to refer and go back to Abstract Functions where I could refer the Scientific Constraint for the limitations of the the variables and decide which to take in for which component.
At first I thought Abstract Functions won’t be that helpful but here they helped a lot.
Flow:
Component → Physical Function → Scientific Constraint → Measurable Variable
Example:
Crankcase → Lubrication → Pressure law → Oil pressure
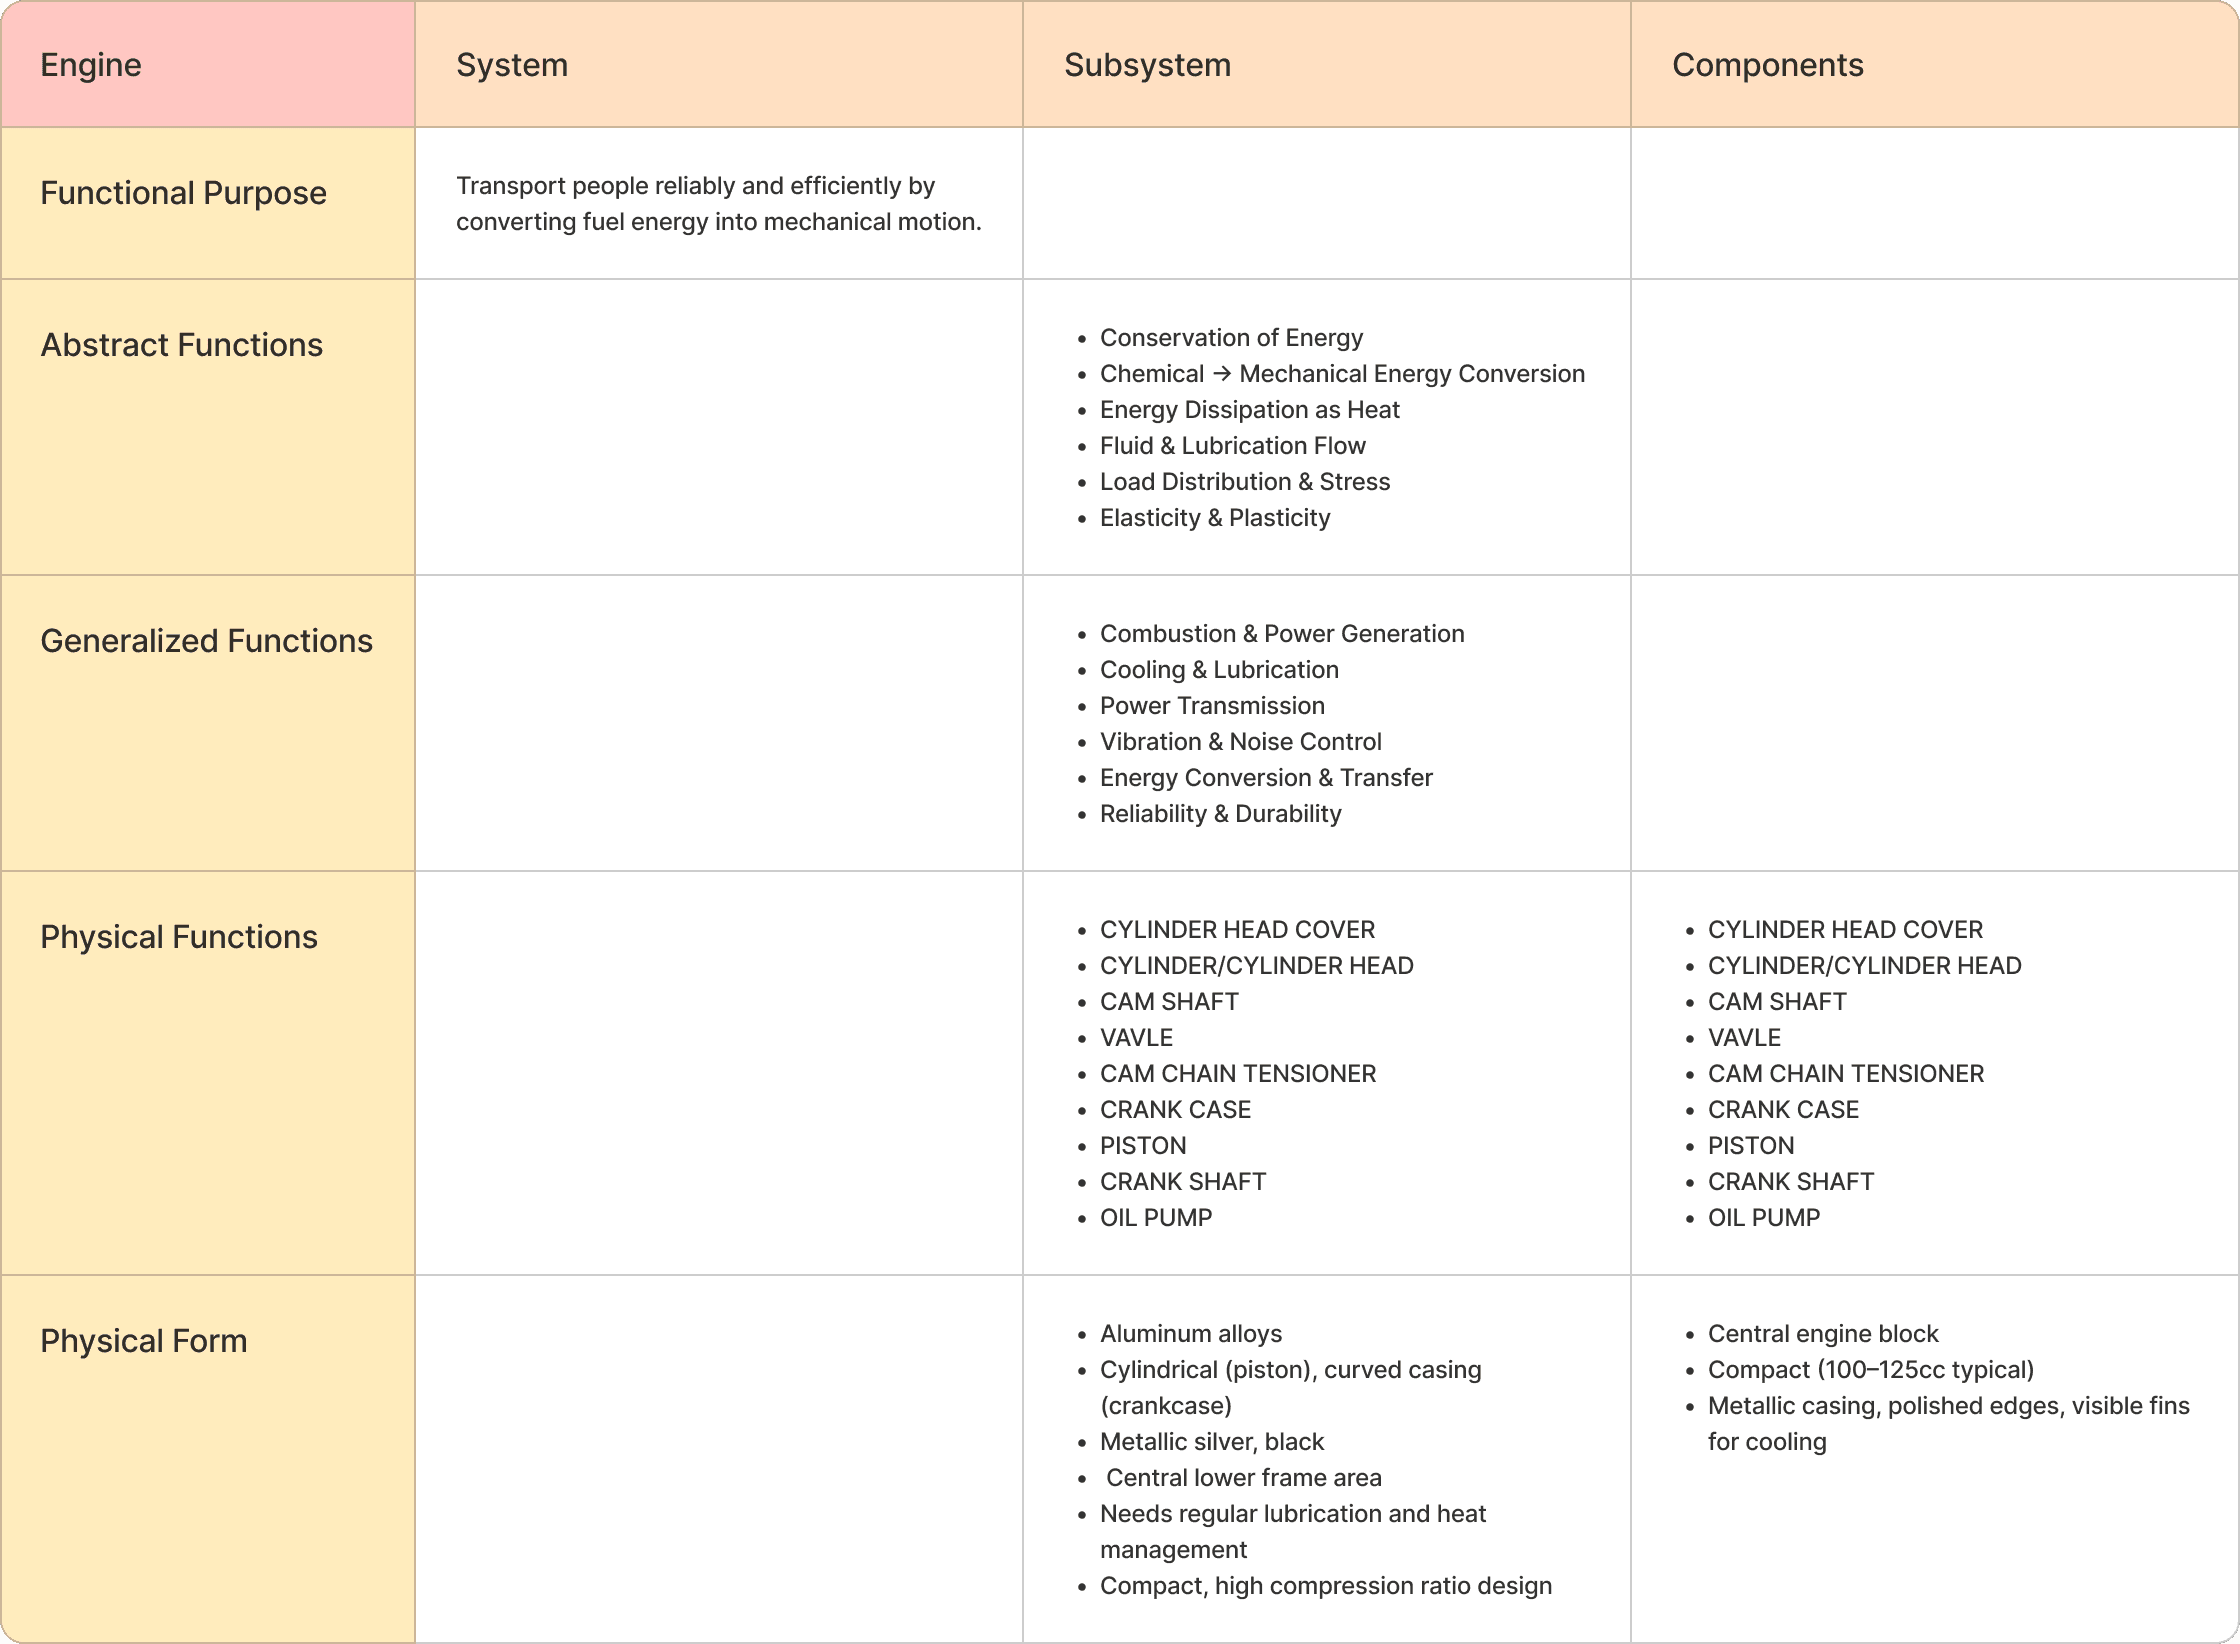
Showing the example of Engine below. You can check all tables here Link
Checking Sensors for Variables
For each and every measurement I had to check which sensor is possible and if not now is it possible in the future.
Showing the example of Engine below. You can check all tables here Link

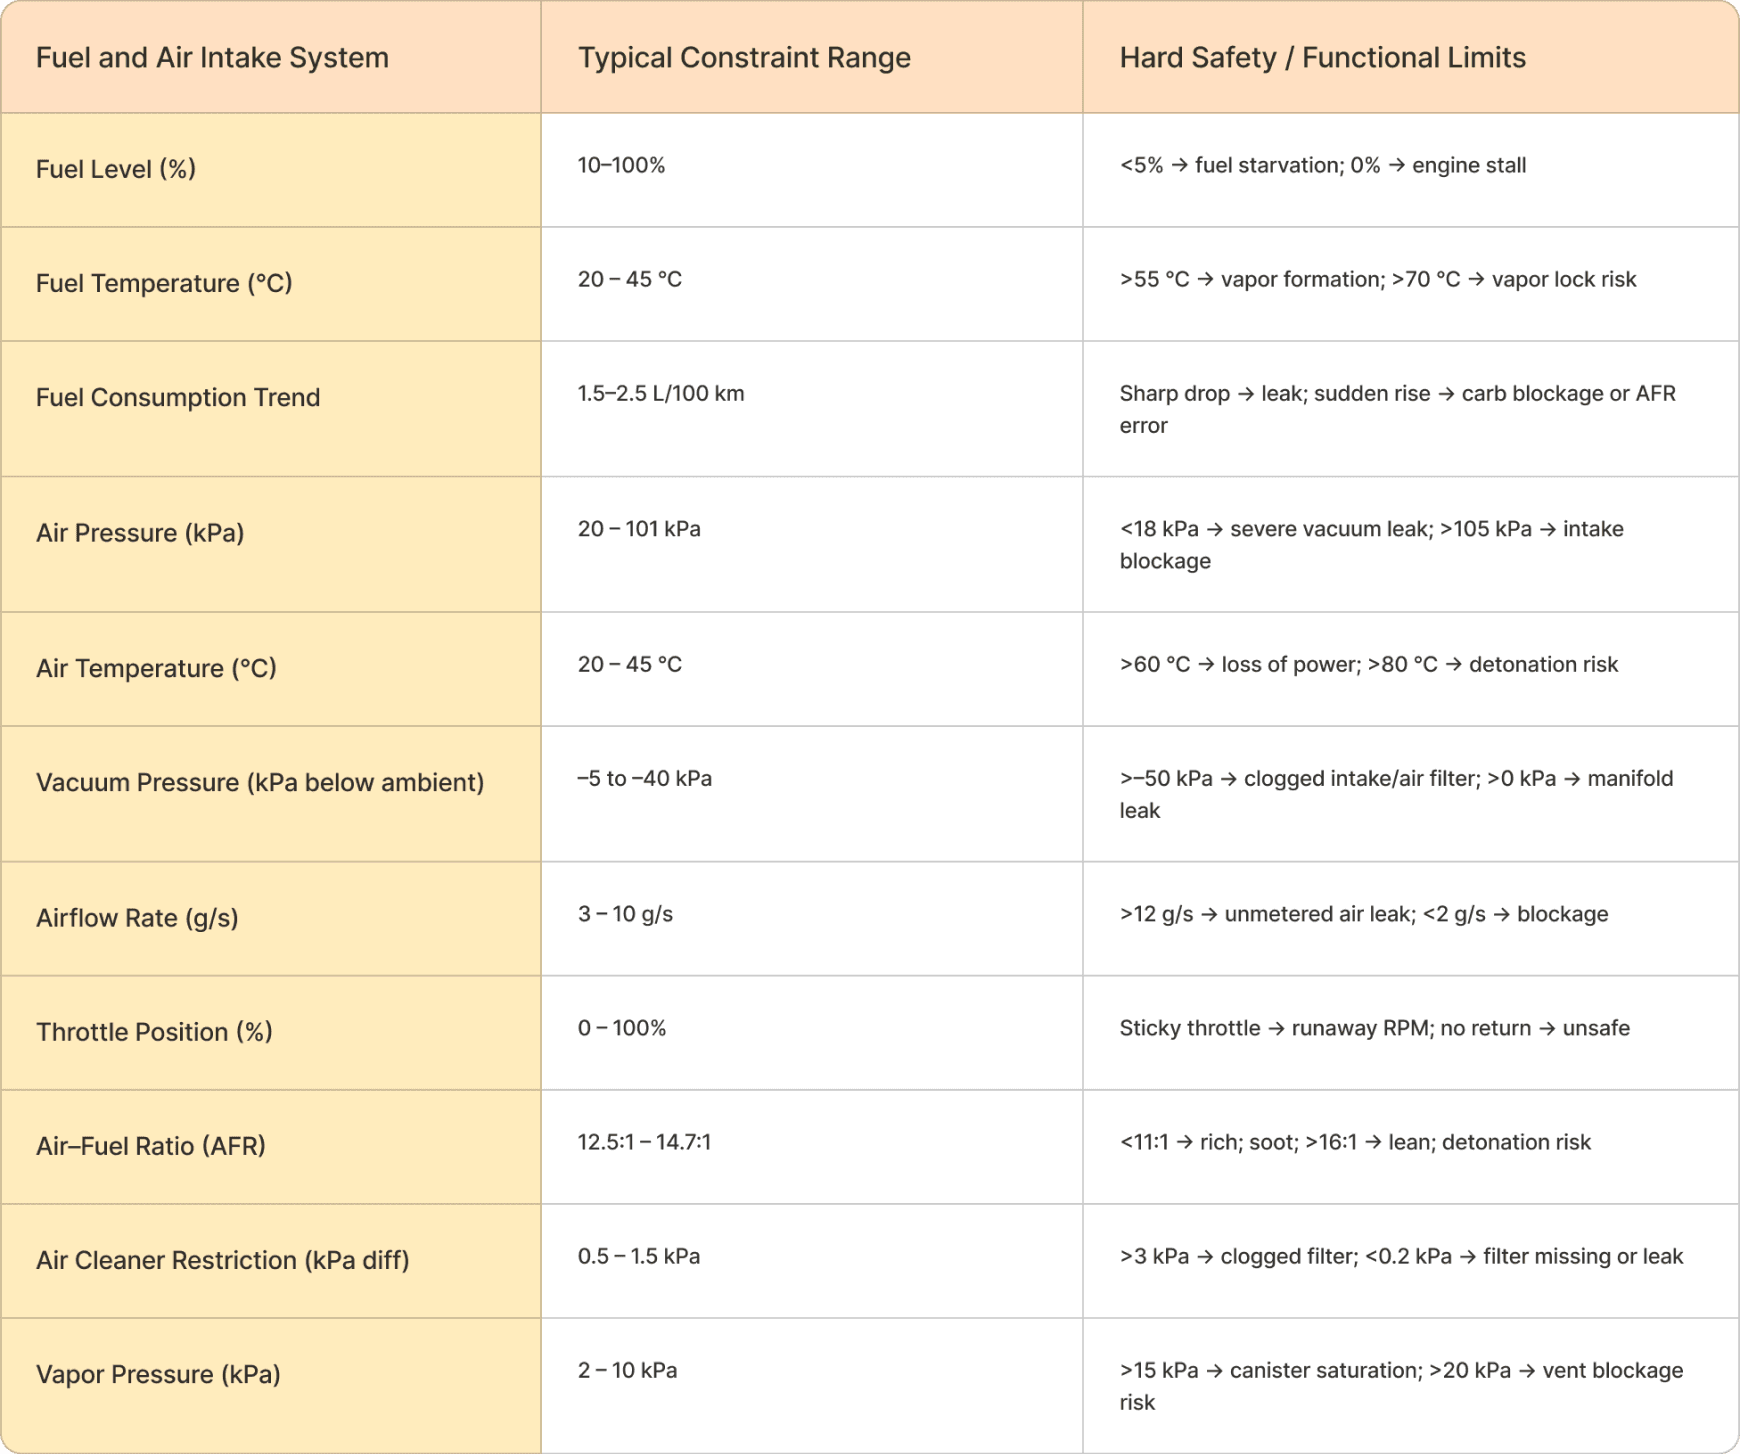
Defining Single Variable Constraints
Defined the typical constraint range and the functional limits for each of the variable of subsystems.
Showing the example of Fuel and Air Intake System below. You can check all tables here Link
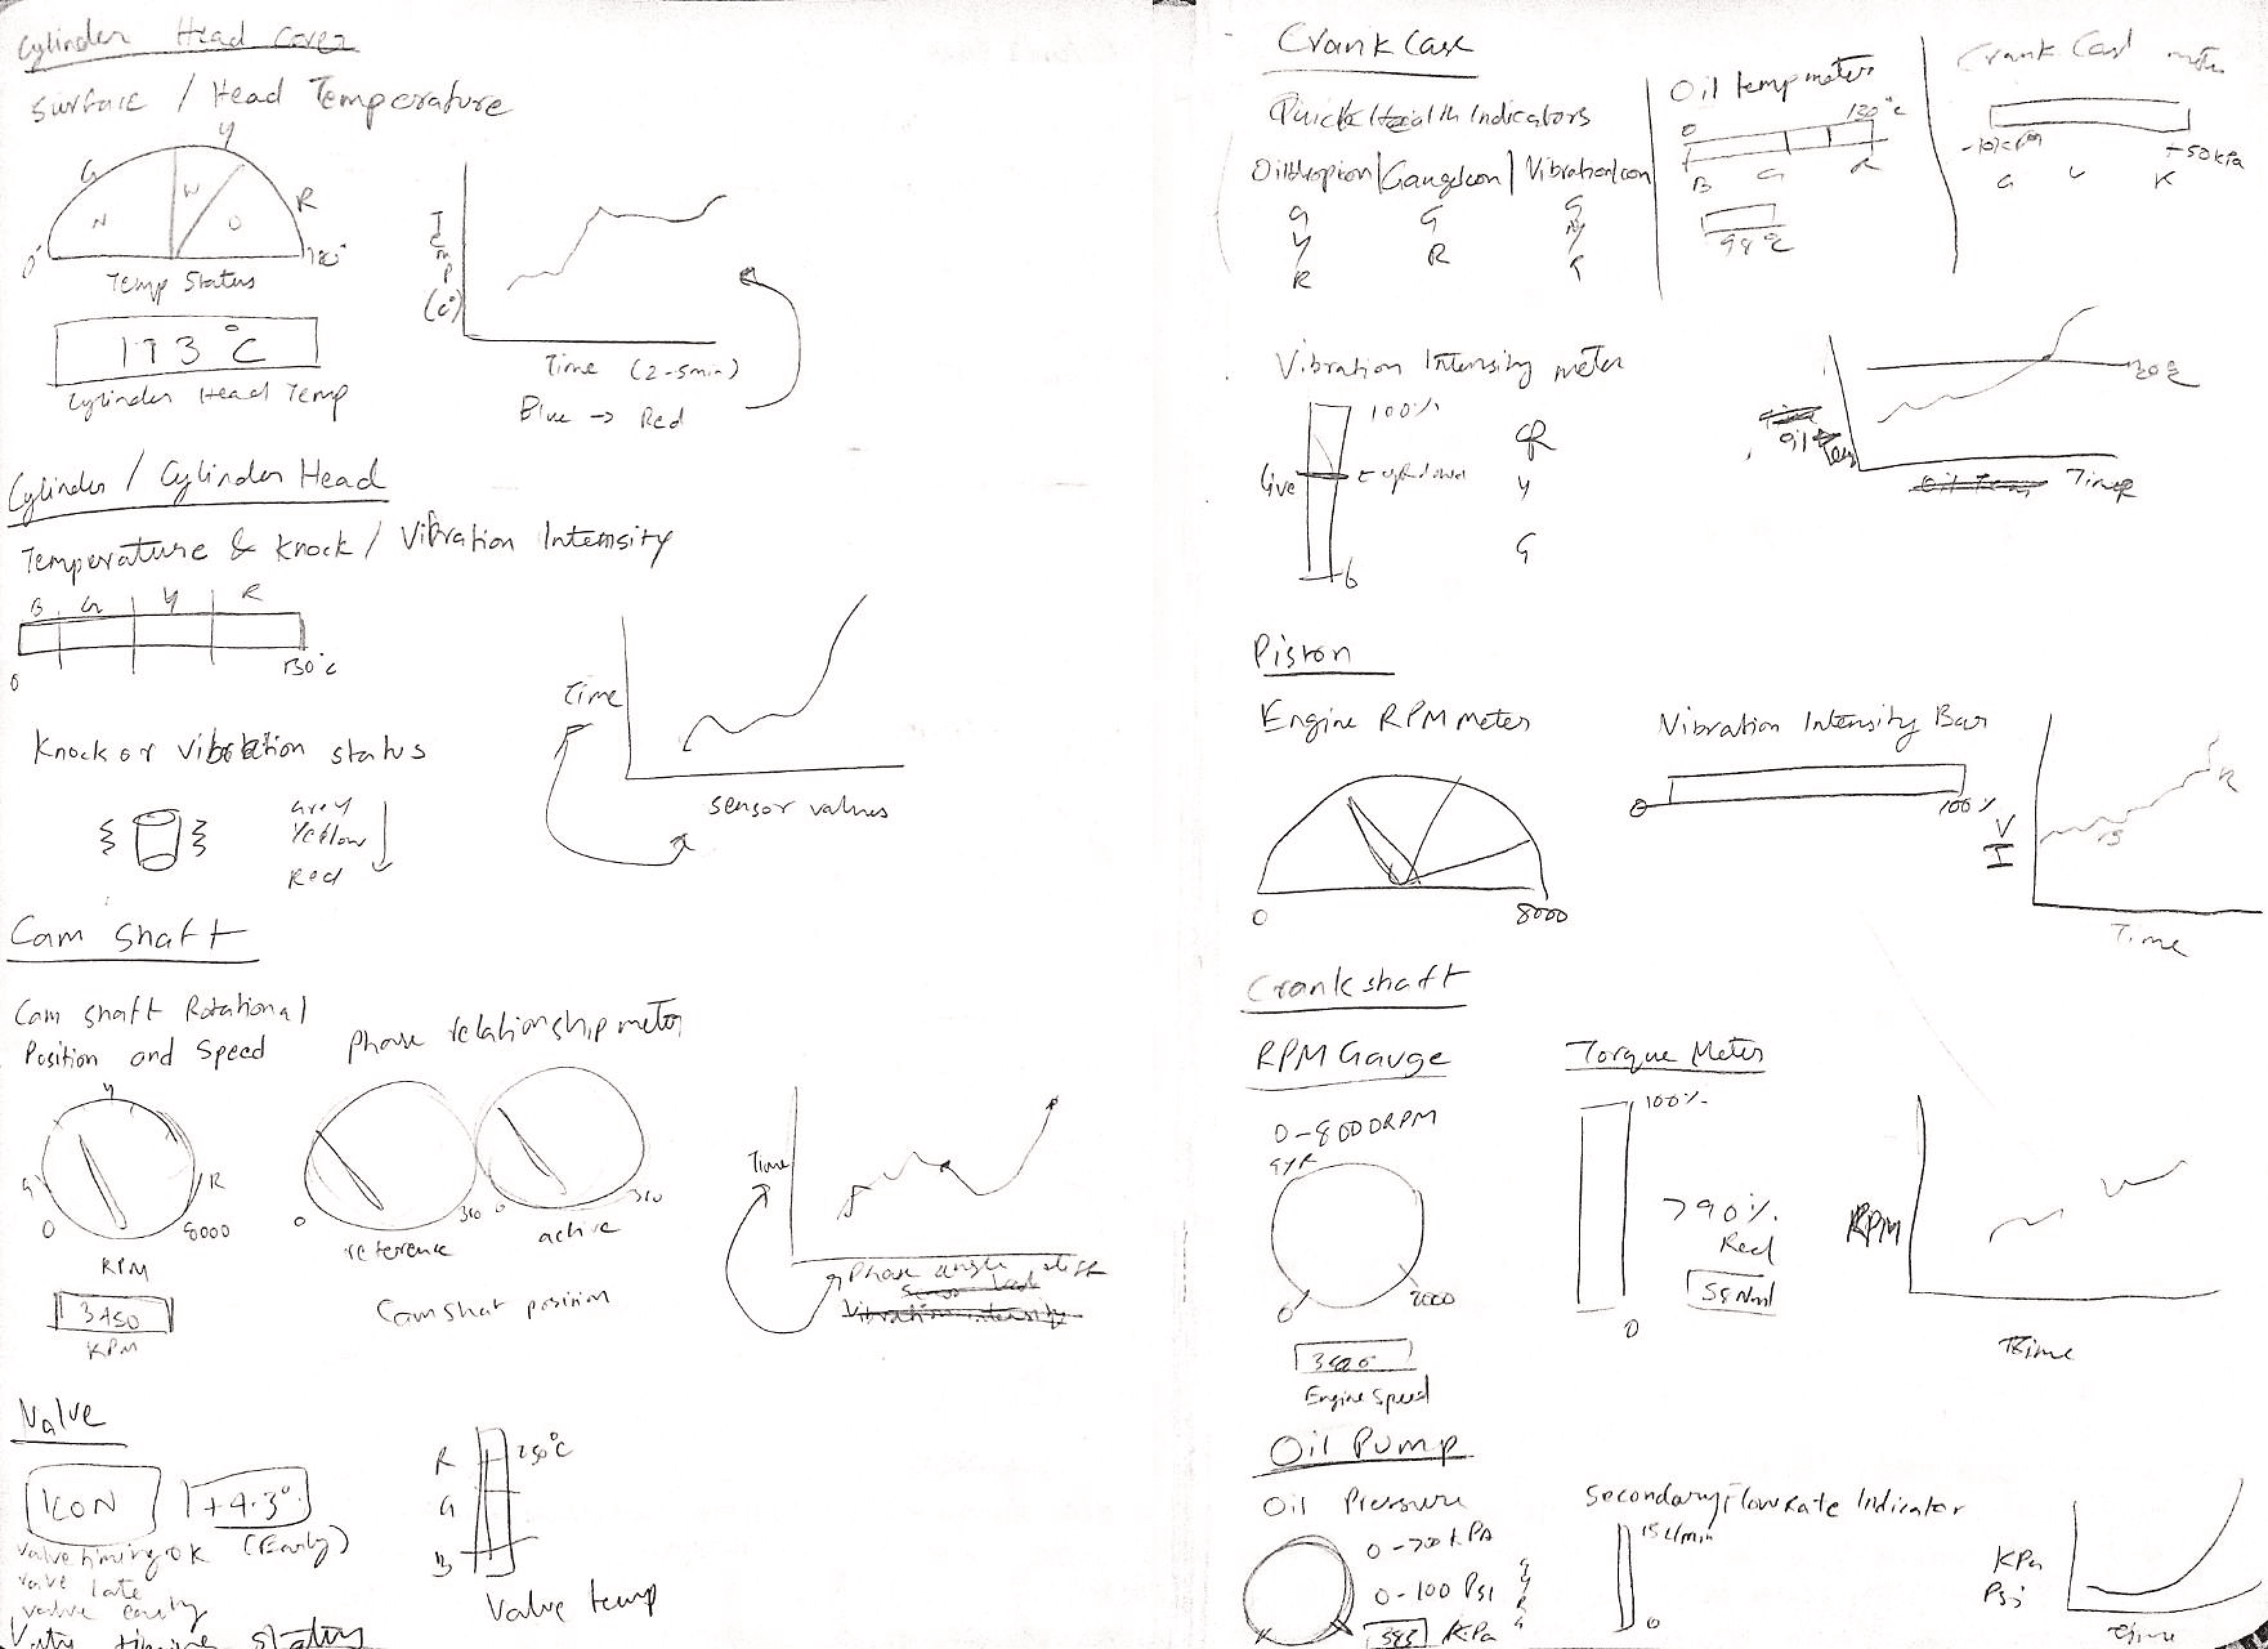
Ideating around the Variable Constraints
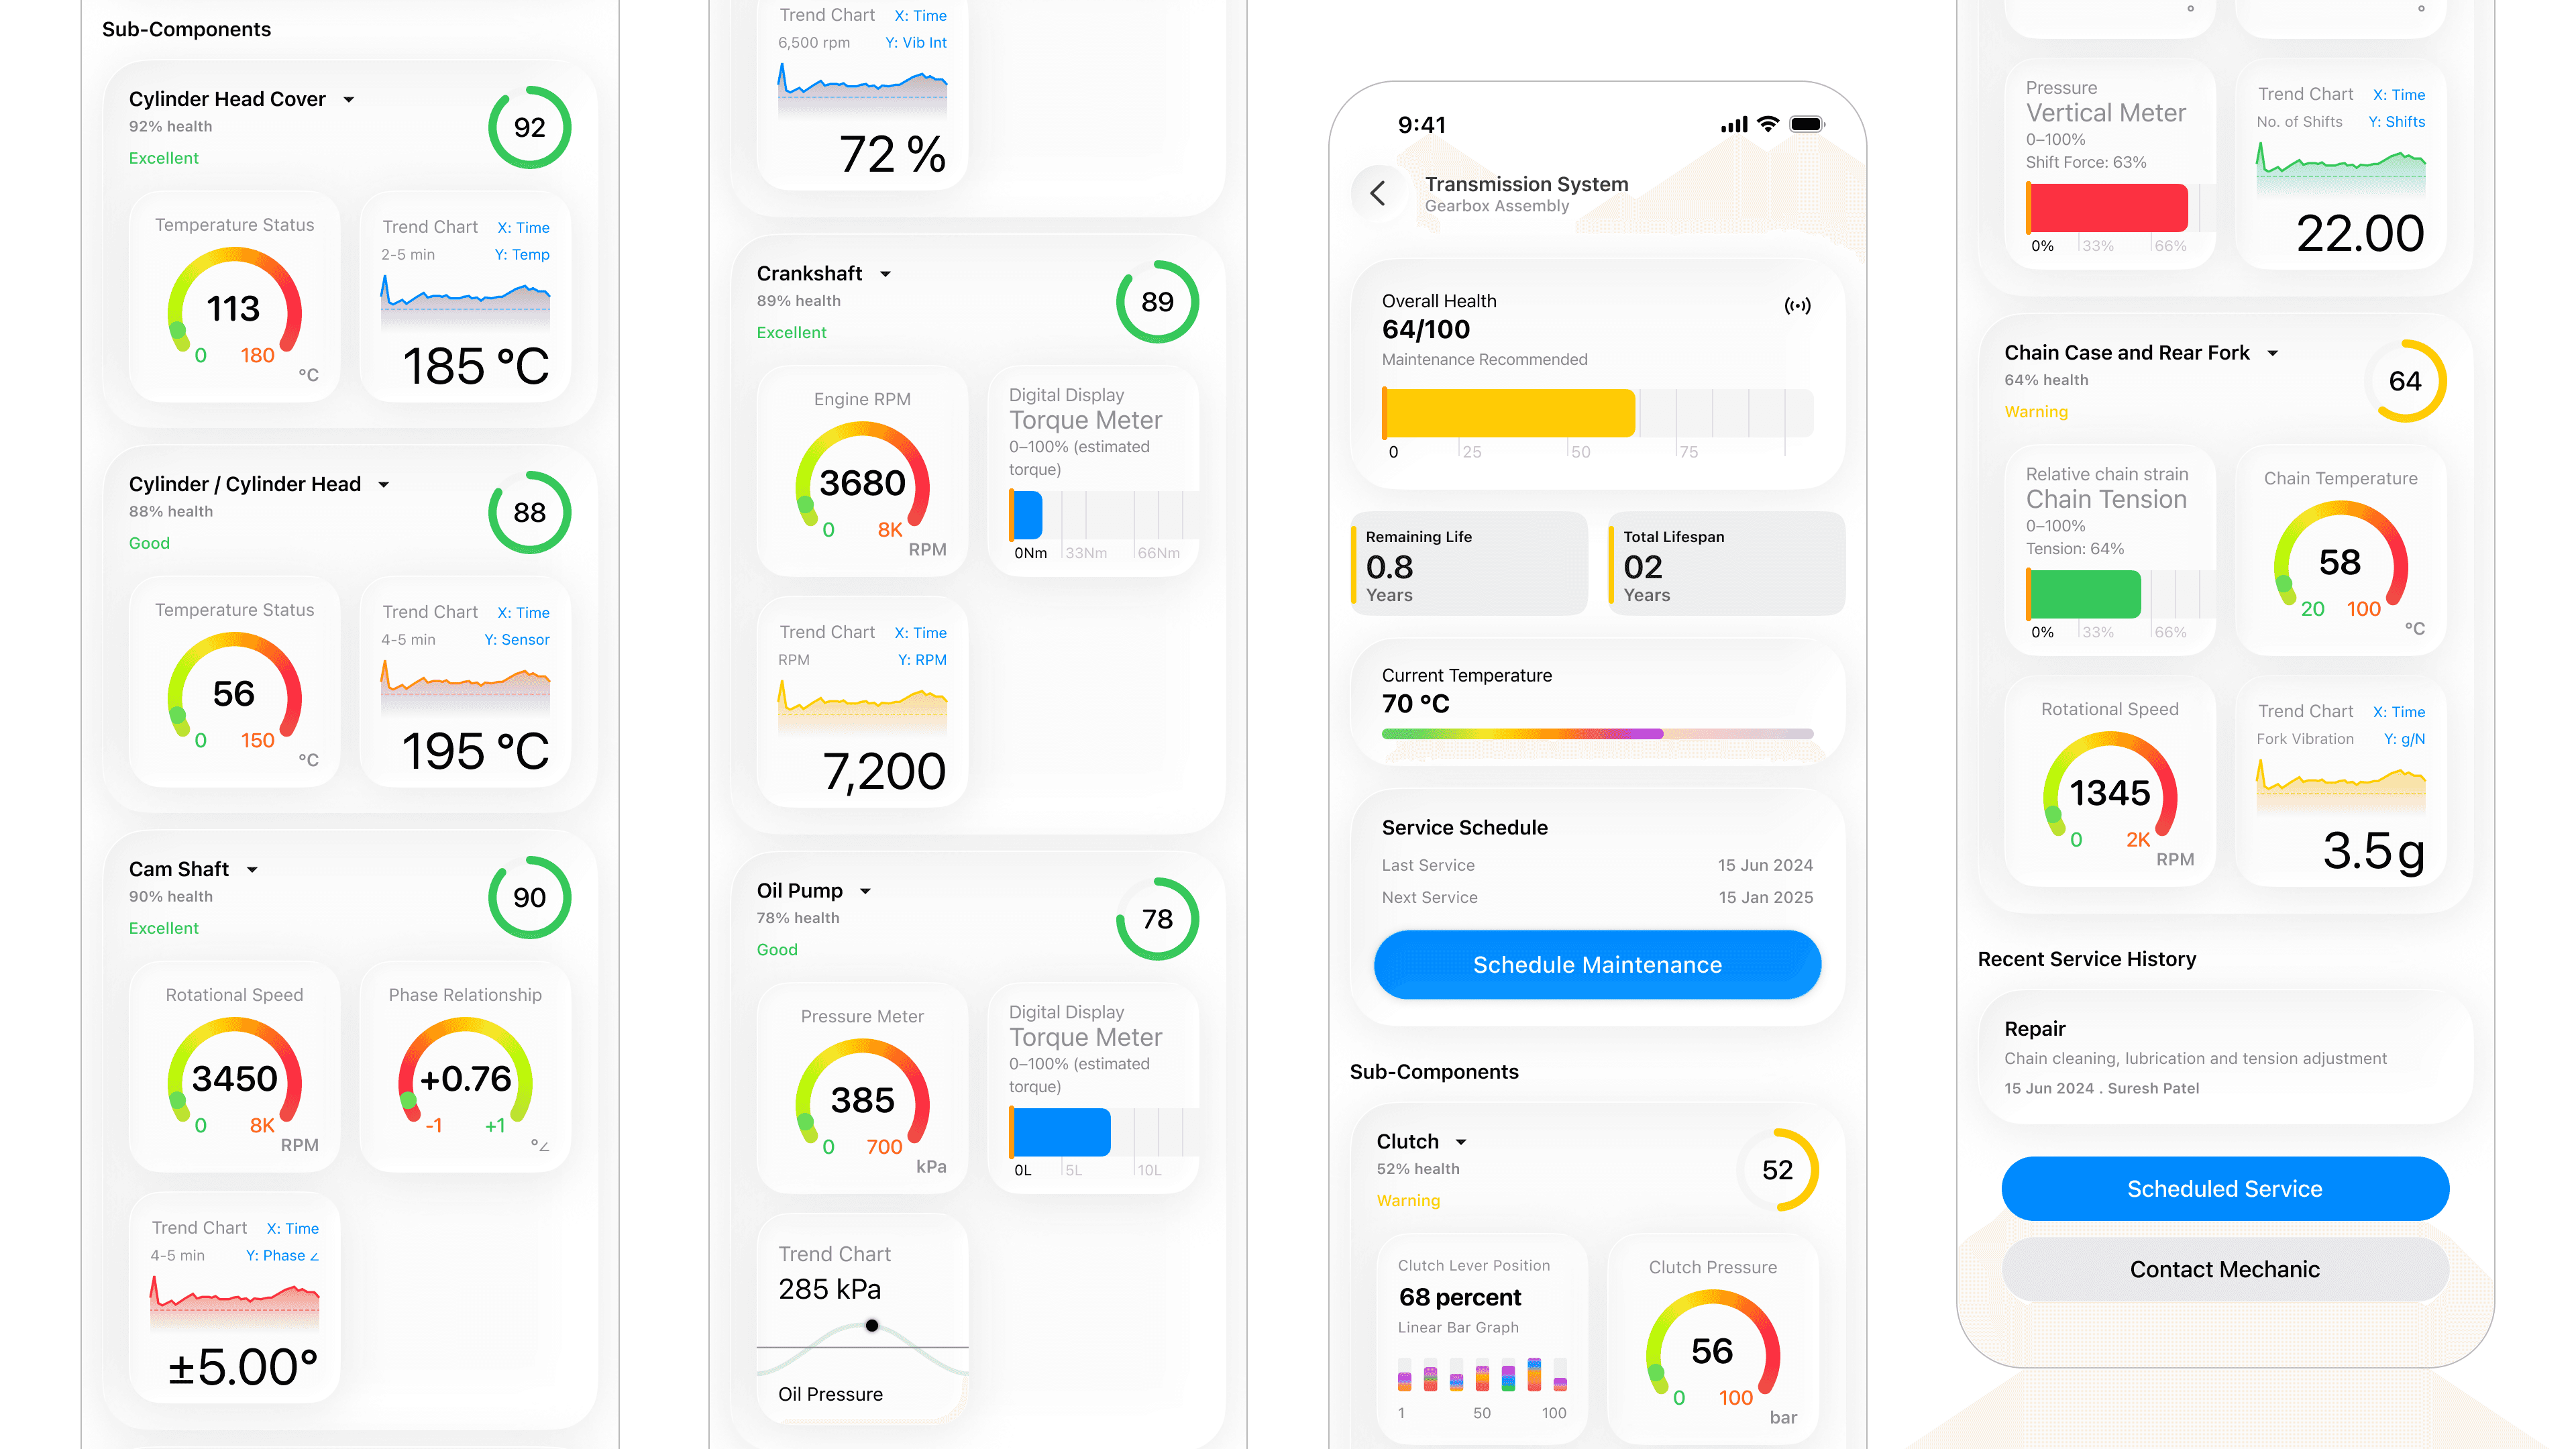
After getting all the required variables and the constraints I started ideating which variable can be shown in what way. I tried to combine propositional, iconic and analogical interface all together in a way.
Below is a example of ideating variables of Engine’s components.
Design System
I decided to follow ios design system for this.
For the showcase of data I went forward and redesigned the apple watch design system.
The square boxes even helps in showcasing data in a proper manner when user scans the bike using the AR interface.
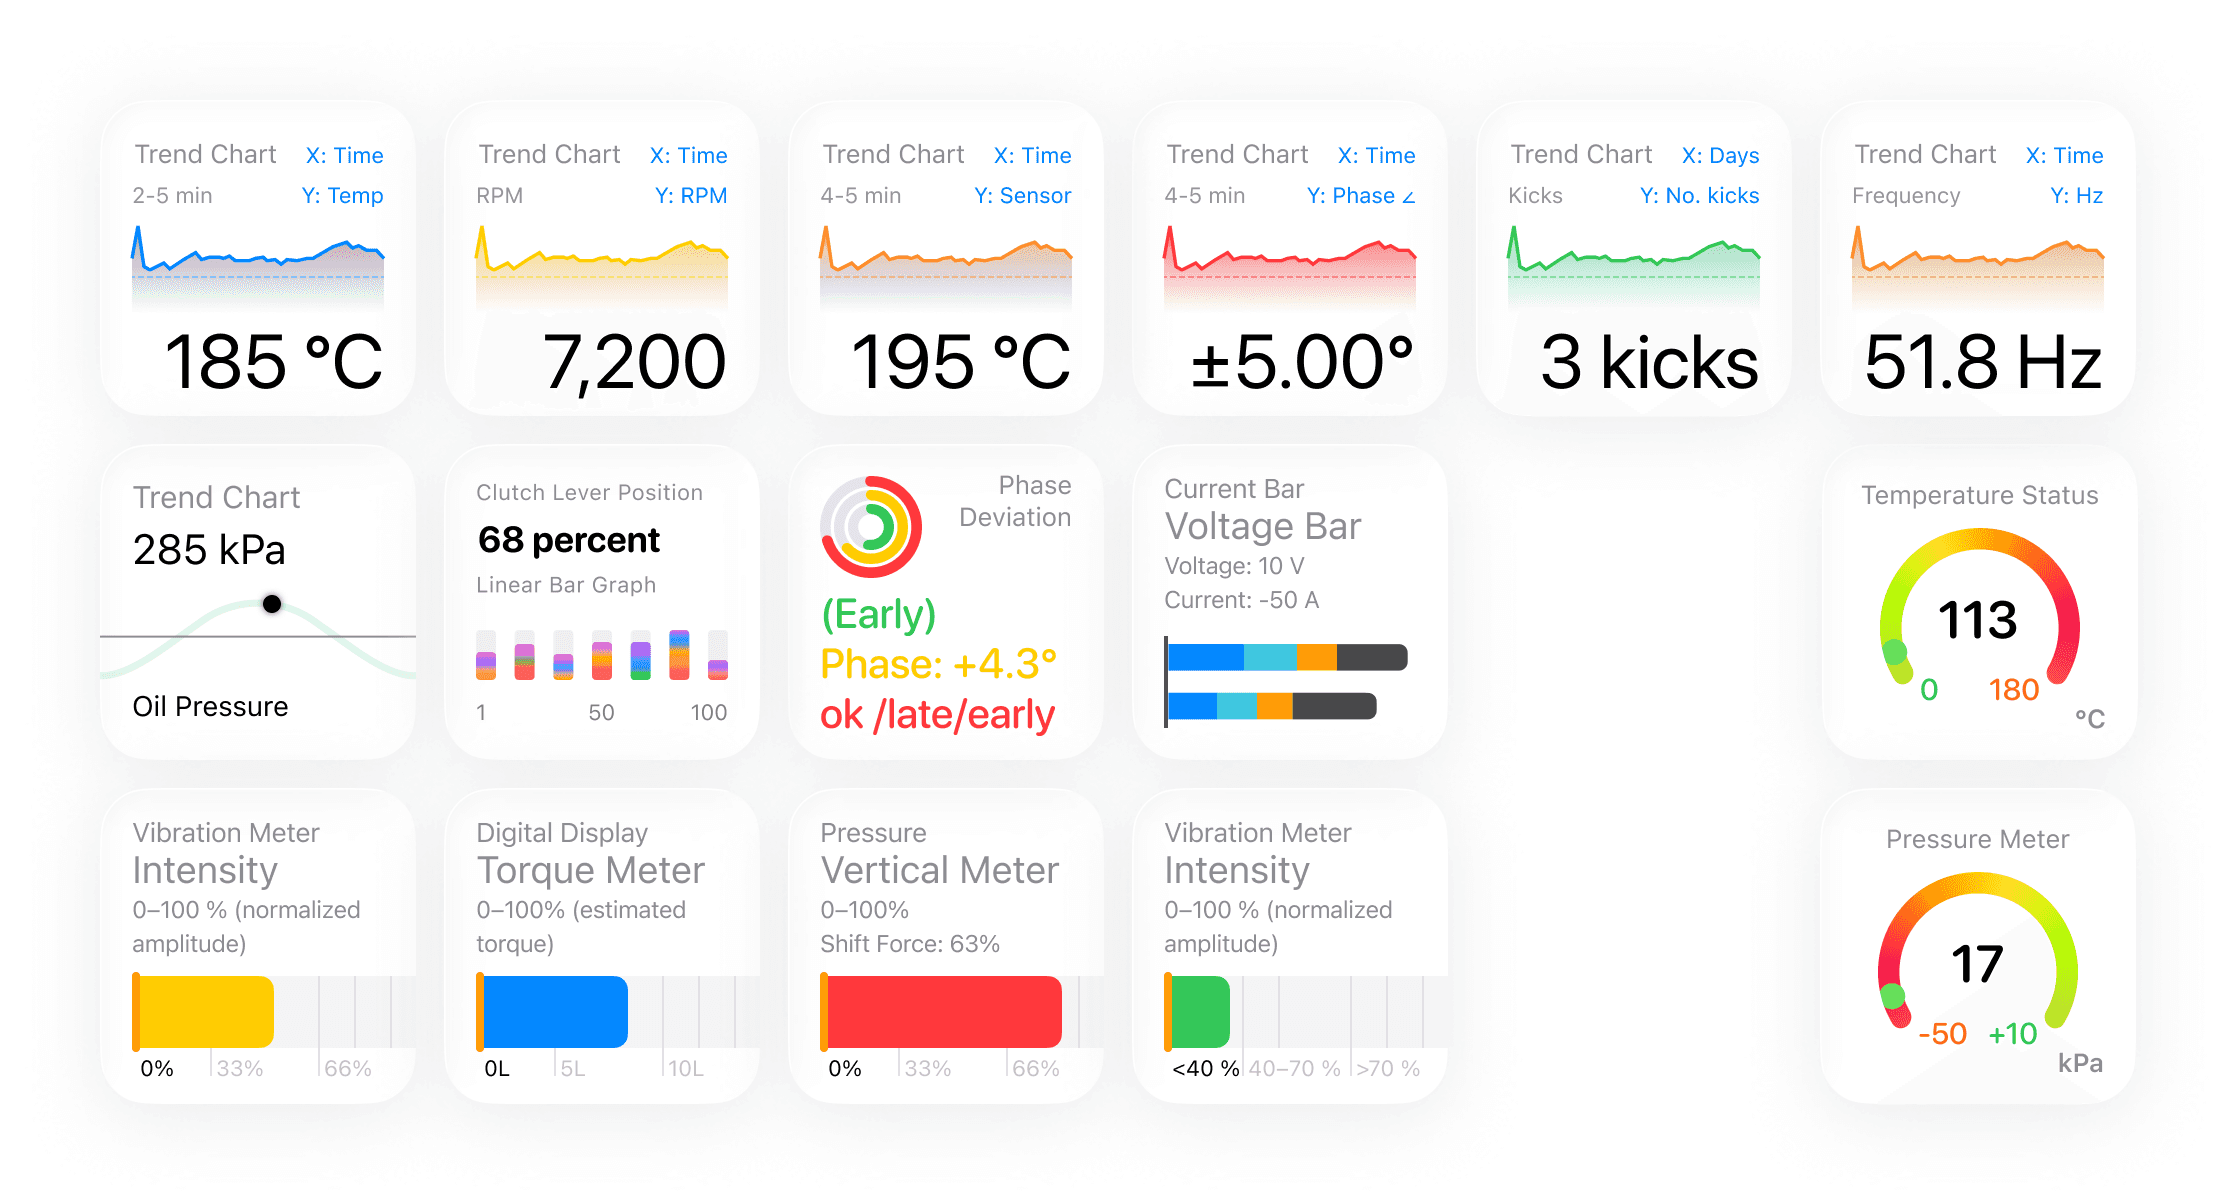
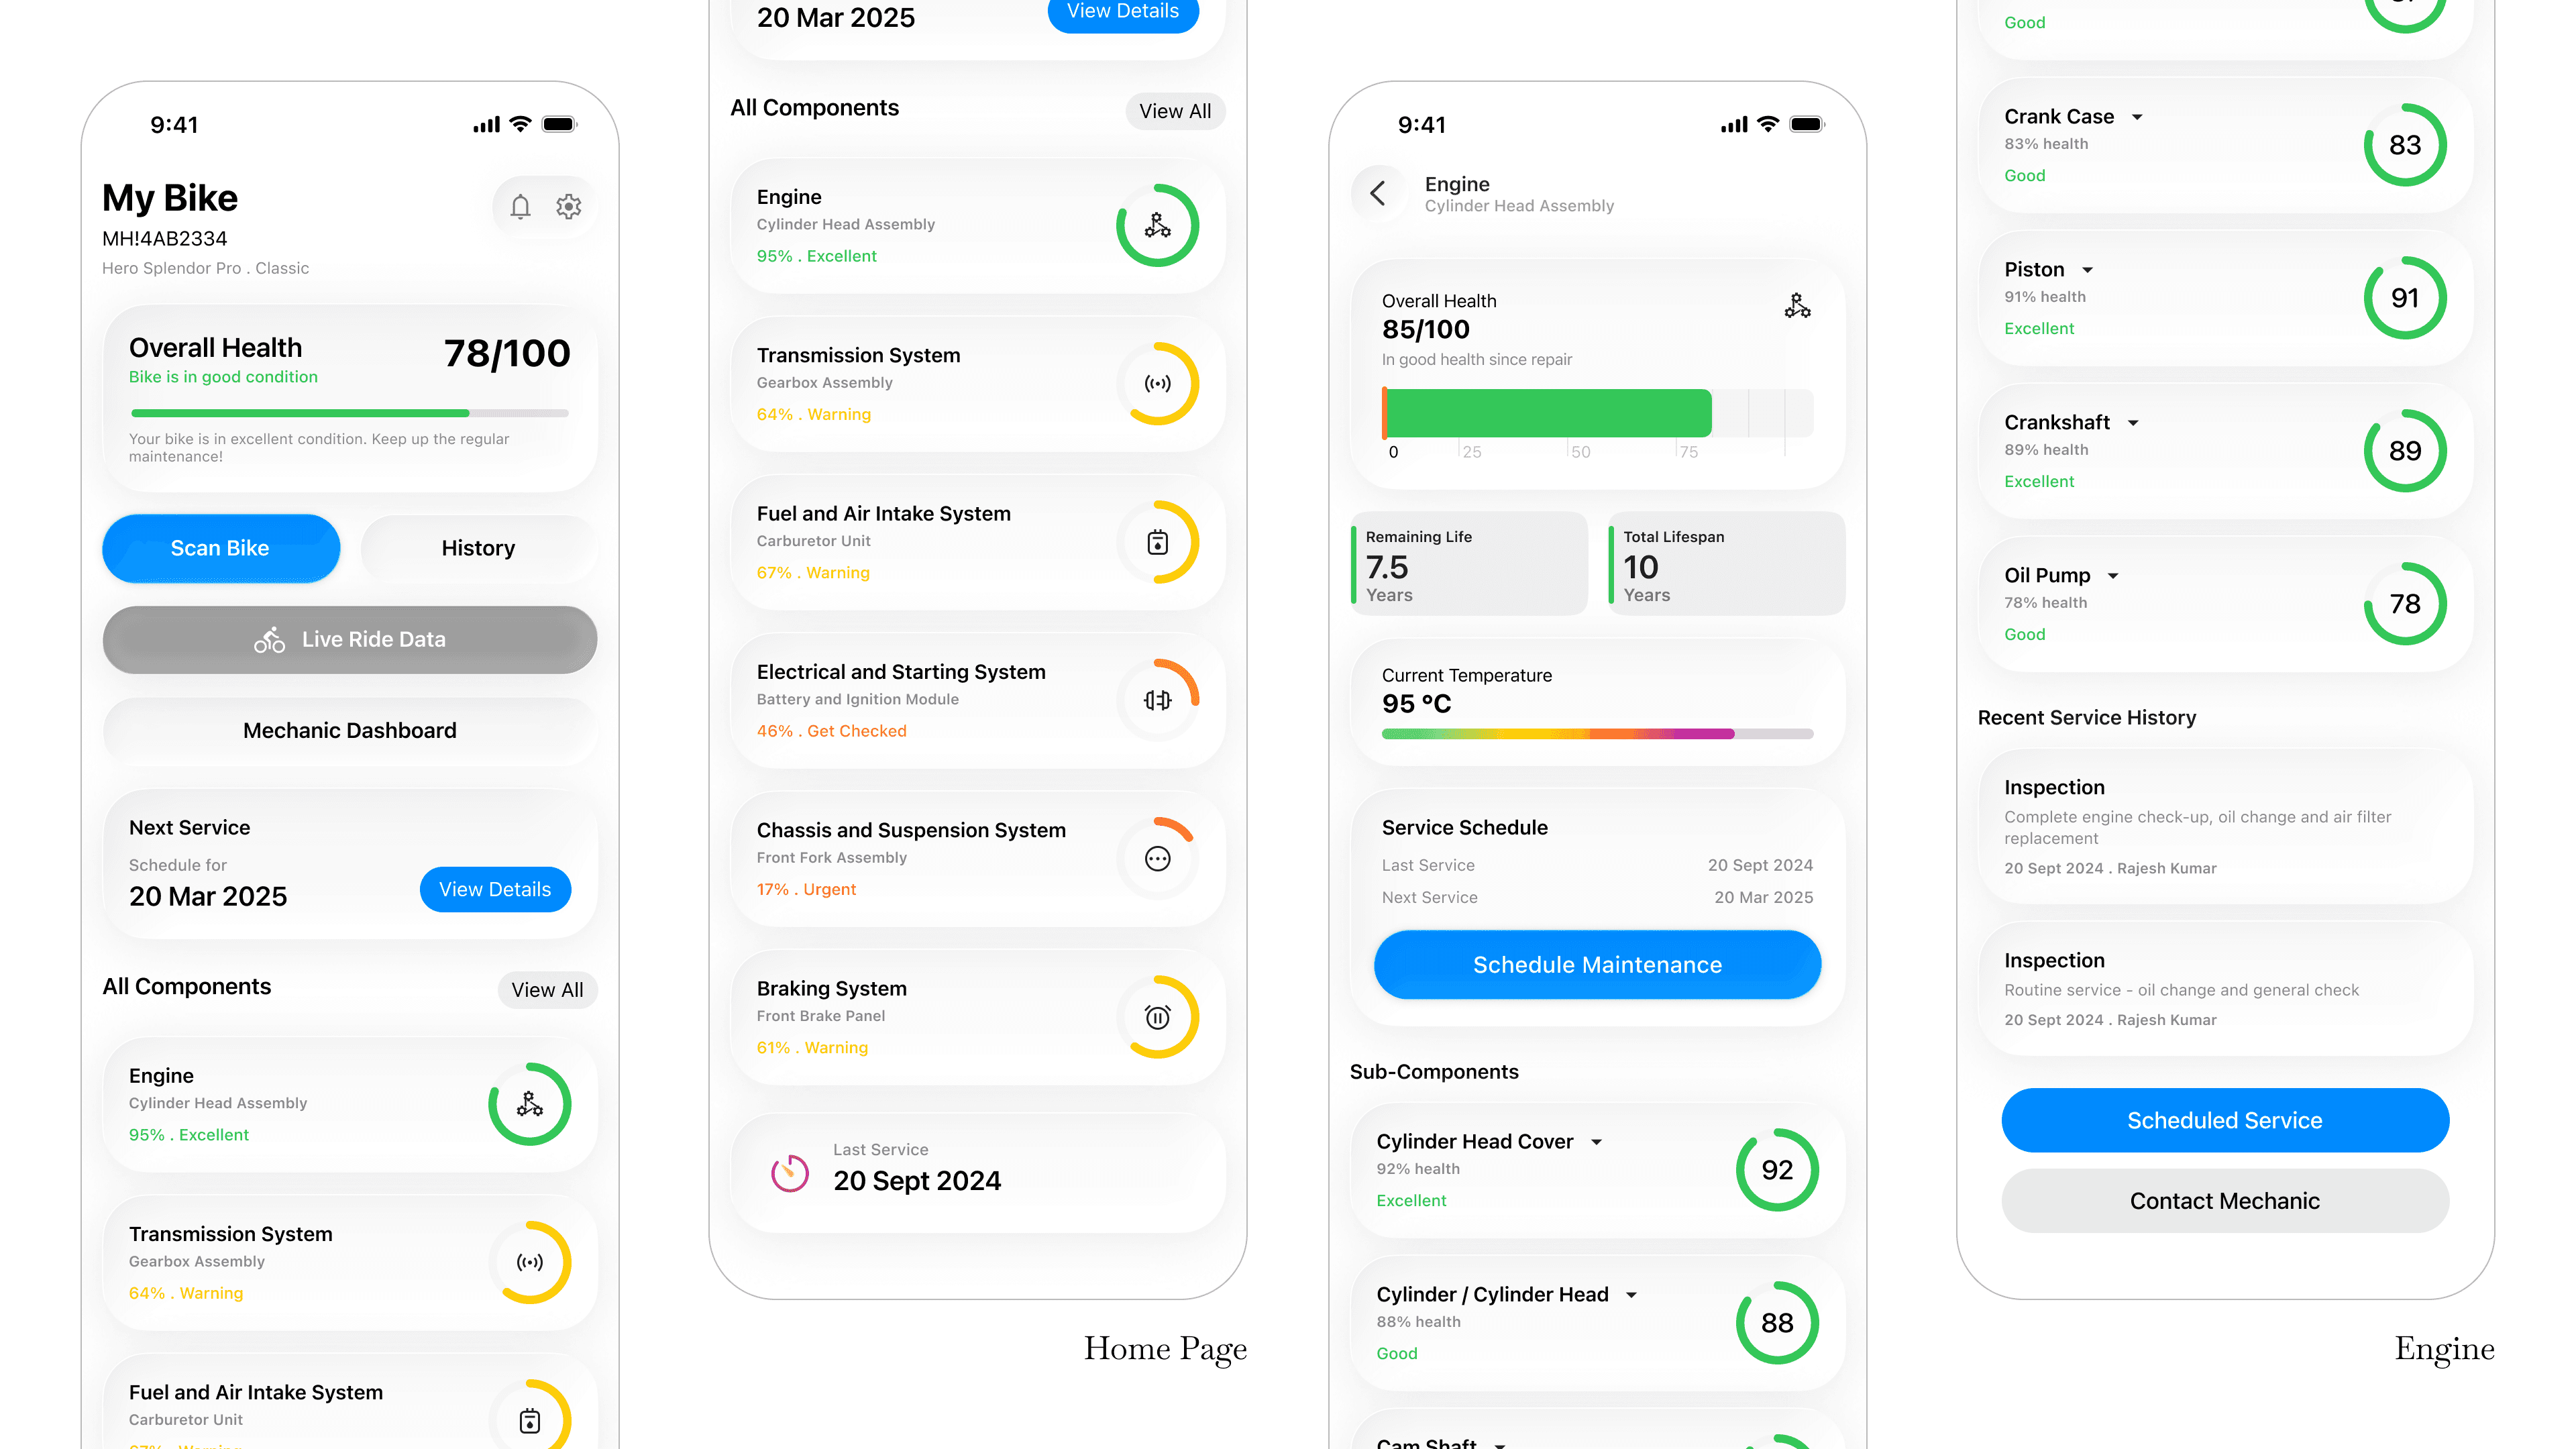
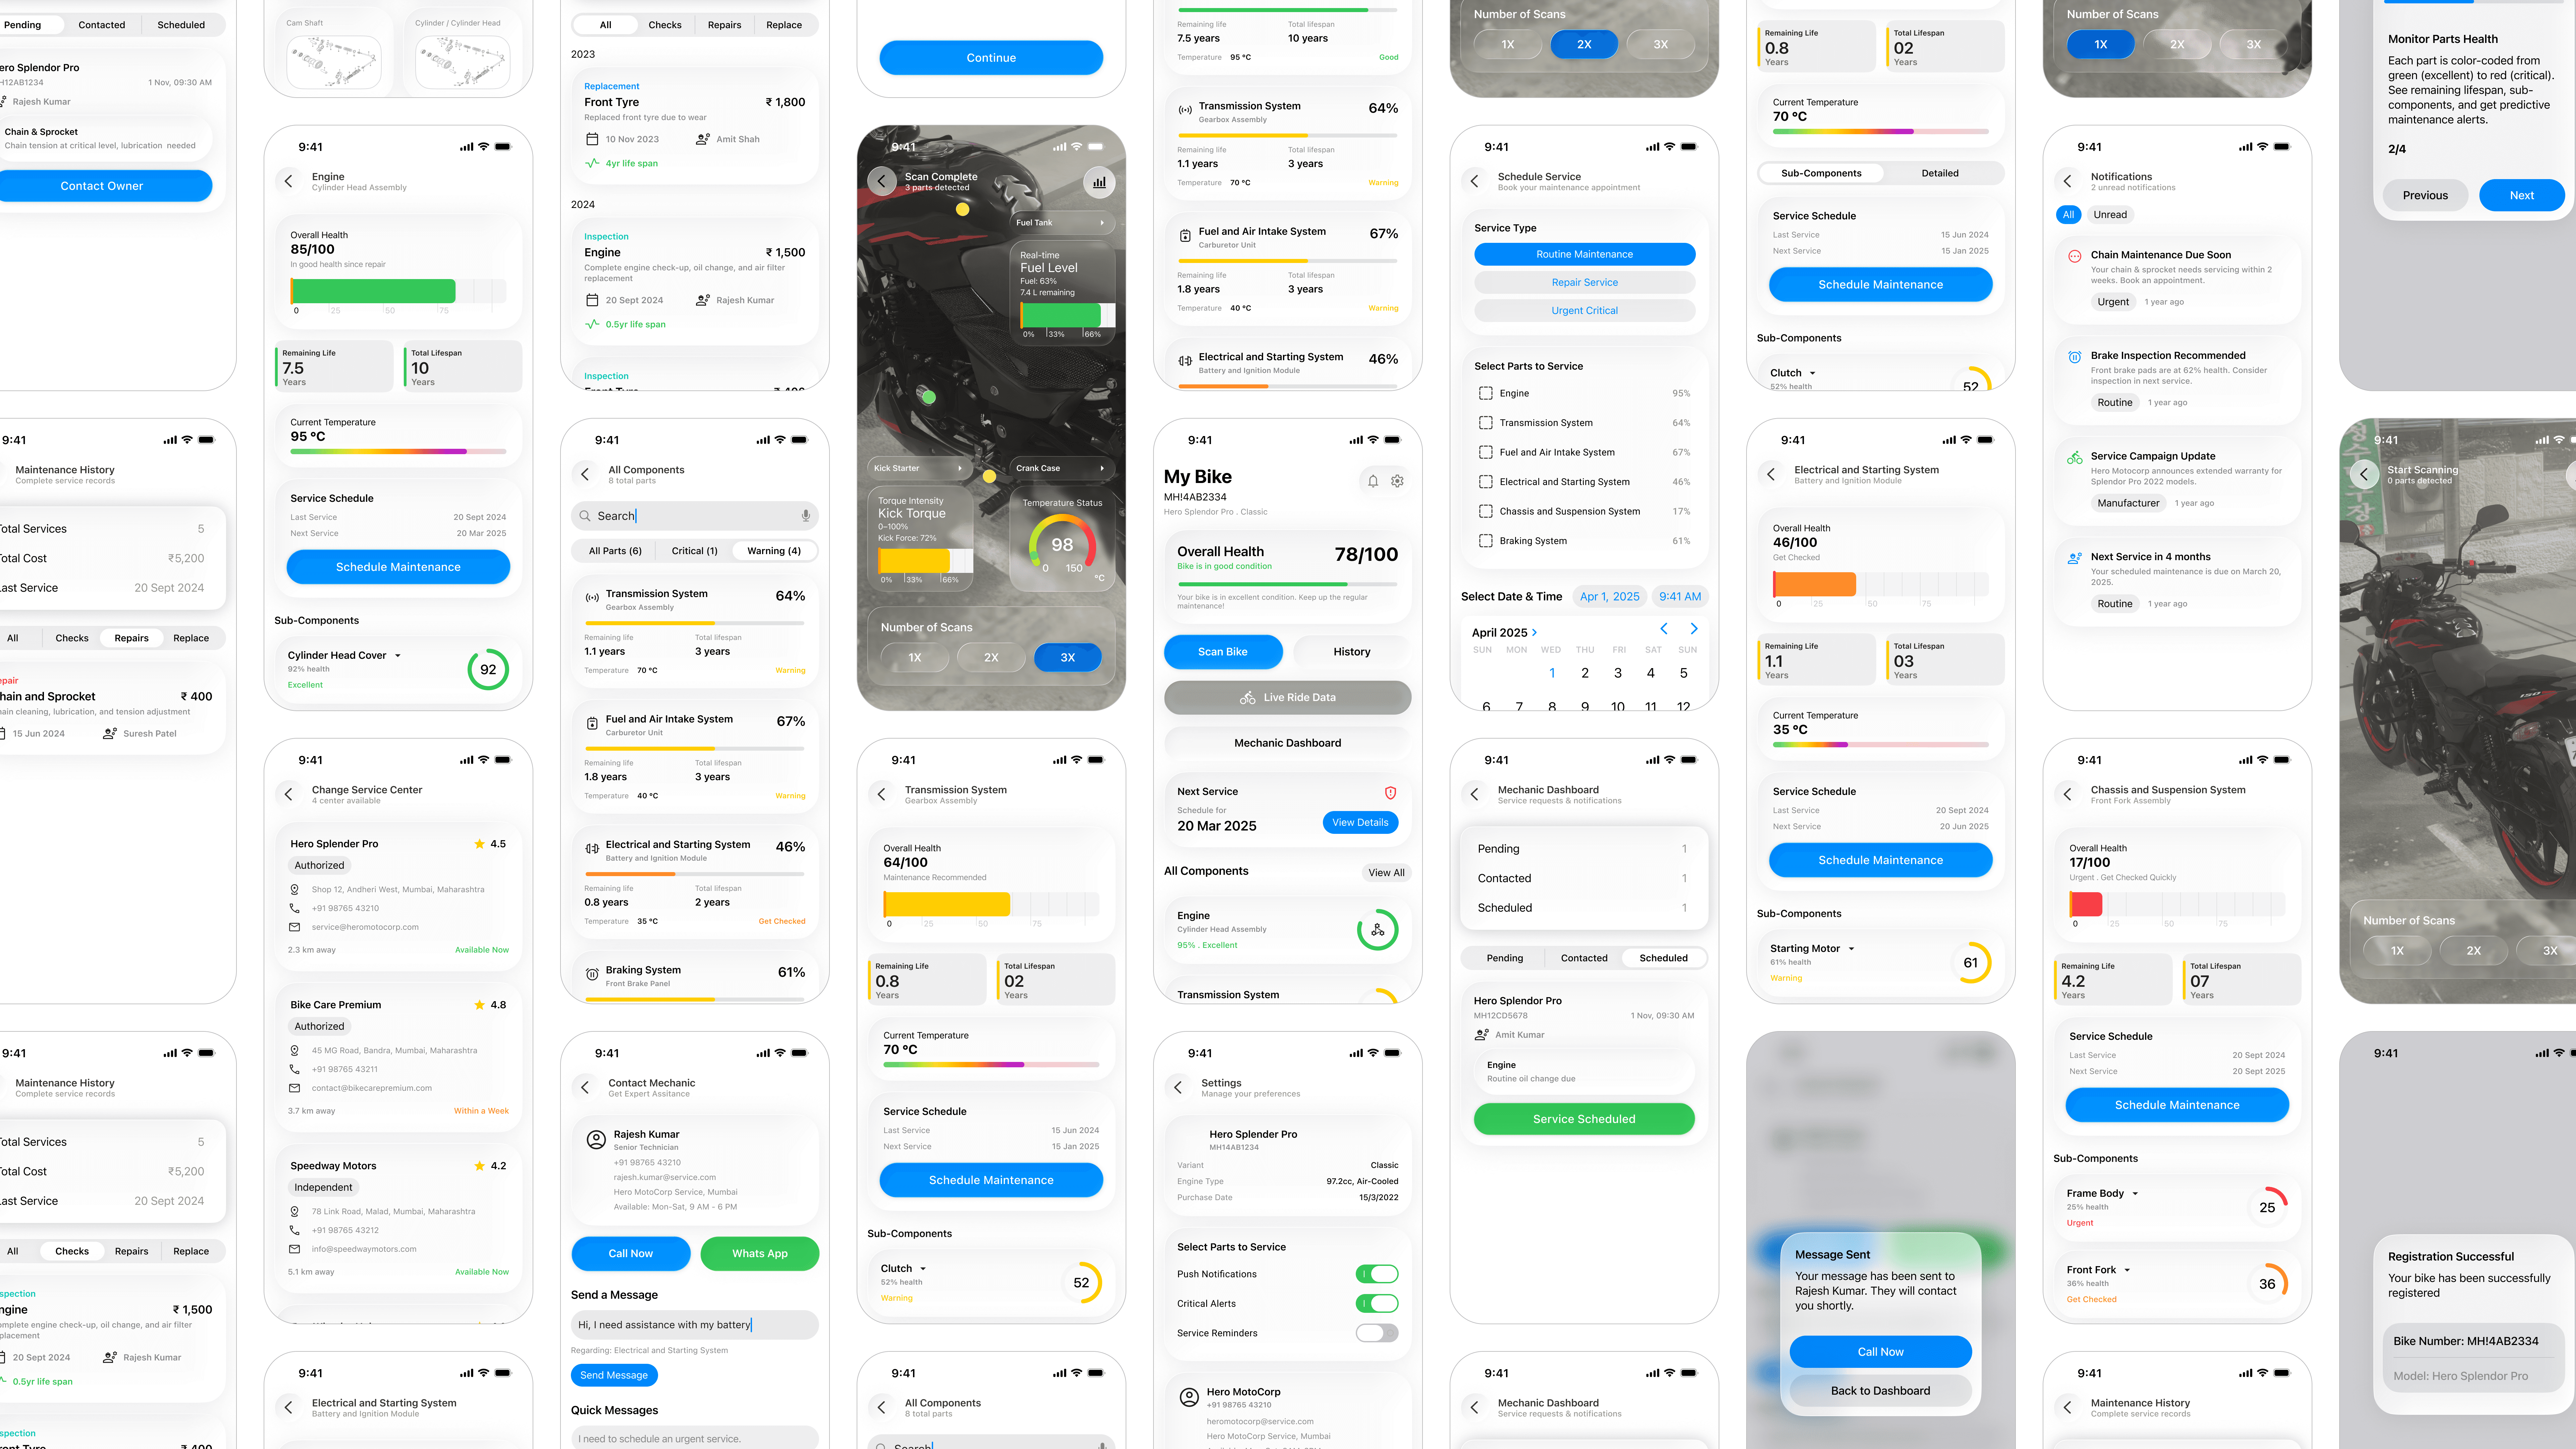
Interface Design
This is the AR interface. The ios glass effect helps a lot in showcasing the data easily. The square design makes it in a systematic in a way. You are allowed to look at 3 components maximum at a time.
Check all subsystems here. Link